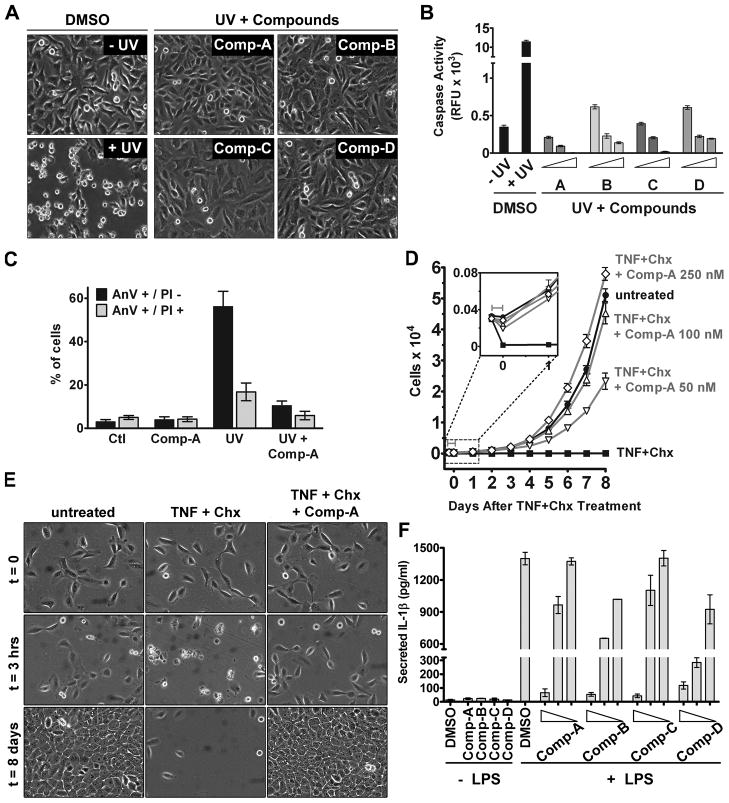
Figure 3. The Identified Compounds Inhibit Cellular Caspase Activation.
(A) Compounds diminish UV-induced apoptotic morphology in HeLa cells. Cells were irradiated with UV and either DMSO or 100 nM of each compound was added to the culture medium. Cells were imaged 6 hours following irradiation.
(B) Inhibition of caspase activation in HeLa cells. Cells were treated as in (A) and collected after 6 hours. Caspase activity in cell extracts was measured. Compound concentrations were 0.5, 1, and 3 μM, as indicated from left to right. Error bars represent the SEM from triplicate experiments.
(C) Annexin V/PI double-staining of UV-treated HeLa cells. Cells were irradiated with UV in the presence or absence of Comp-A (100 nM). Cells were collected 6 hours following irradiation, stained with Annexin V-FITC and PI, and subjected to FACS analysis. Error bars represent the SEM of five experiments.
(D) MCF10A cell growth following treatment with TNF-α and cycloheximide (Chx). Cells were treated with TNF-α and Chx in the presence of either DMSO or Comp-A at the indicated concentrations. After 3 hours (denoted by gray bar), TNF-α, cycloheximide, DMSO and Comp-A were removed and growth medium was replaced, and the number of viable cells was determined at the indicated time points using Resazurin dye. Error bars represent the SEM from triplicate experiments.
(E) Long-term survival of MCF10A cells following TNF-α + cycloheximide induction. Cells were treated with TNF-α and Chx in the presence of either DMSO or 100 nM Comp-A as in (D). Cells were imaged before induction, 3 hours later, and 8 days later.
(F) Inhibition of IL-1β secretion from J774 cells following LPS stimulation. J774 cells were stimulated with 1 μg/ml LPS in the presence of DMSO or compounds. After 24 hours, IL-1β in medium was measured by ELISA. Compound concentrations were 2, 1, and 0.5 μM, as indicated from left to right. Error bars represent the SEM from triplicate experiments.
See also Figure S3.

