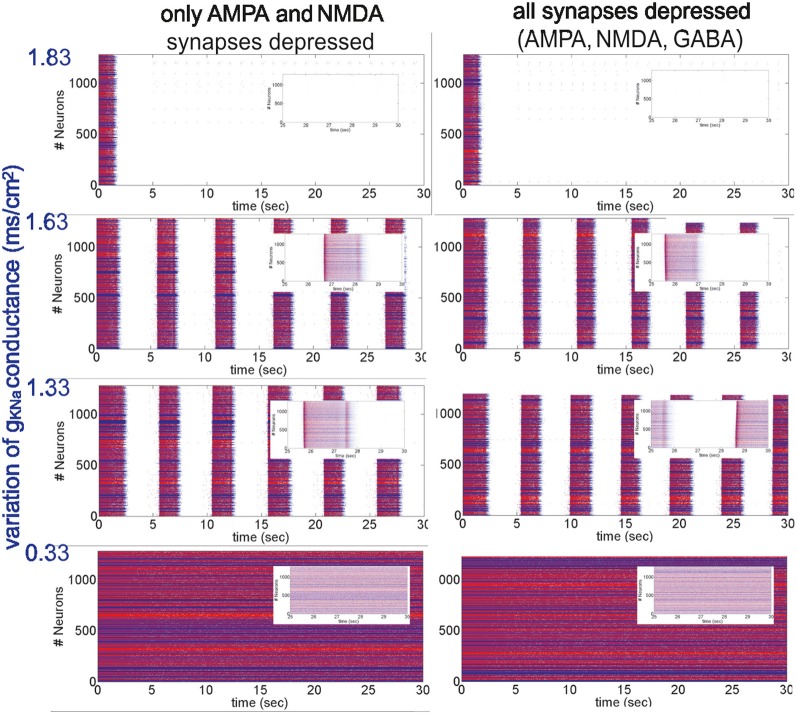
Figure 2.
Different patterns of network activity given by different Na+-dependent K+ conductances gKNa. Left column, excitatory synaptic connections depressed (fAMPA,NMDAD = 0.9); right column, excitatory and inhibitory synaptic connections depressed (fAMPA,NMDA,GABAAD = 0.9). Inset figures show the last 5 s of each simulation, respectively. From top to bottom, low activity to high activity with firing frequencies during UP states for the left (right) panel of 0(0) Hz, 12(11) Hz, 17(18) Hz and 30(30) Hz, respectively.

