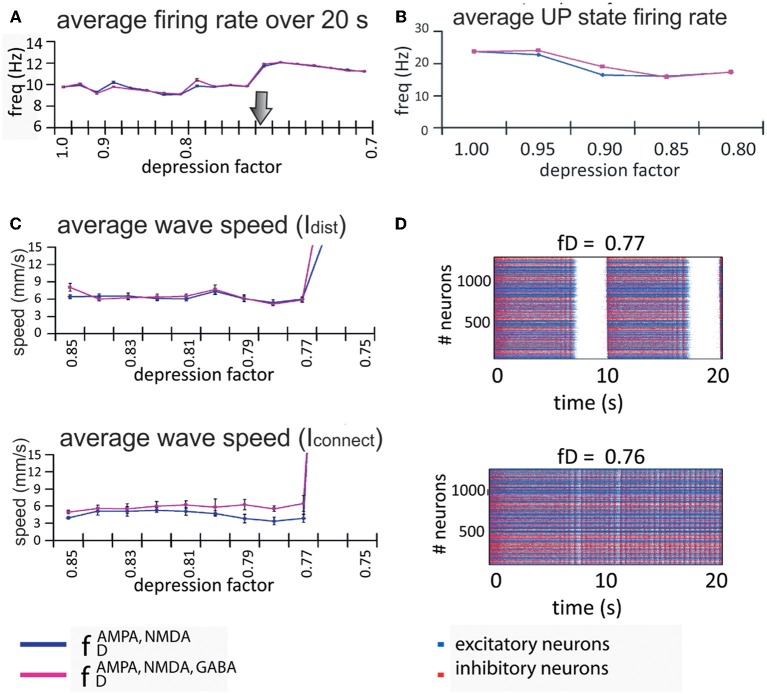
Figure 6.
Firing rate and propagation of UP states in the model network. (A) Rate of wave propagation in the network is basically maintained during the UP/DOWN states regime; this rate is increased when the network activity changes into a continuous firing regime. We found no difference between a network with only excitatory connections depressed (blue line) and a network with both excitatory and inhibitory connections depressed (pink line). The arrow marks the transition point from the oscillatory regime to the continuous firing regime. (B) Intra-up-state rate (y-axis) for each depression factor (x-axis). (C) Both indices (Idist, middle panel, and Iconnect, bottom panel at the left) show that for values of the depression factor (x-axis) greater than fD = 0.75, the wave propagation speed (y-axis) is more or less maintained at the same level, after which the network passes through some kind of bifurcation and starts increasing its wave propagation speed. Since there are no waves during non-oscillatory regime, the index values are no longer useful. (D) Raster plots for two depression factors (middle and bottom panels at the right): at fD = 0.77 the network activity presents UP and DOWN states while at fD = 0.76 the network is at a non-oscillatory regime.

