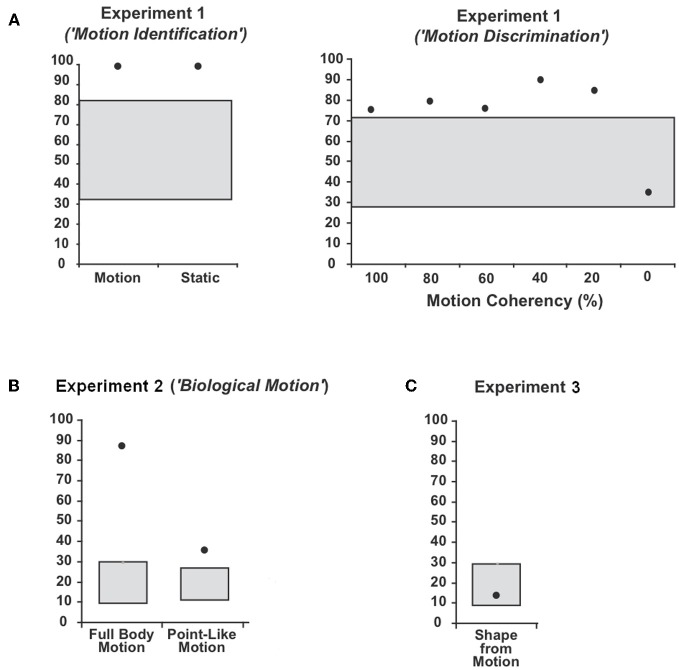
Figure 3.
Average percentage and 95%-confidence interval for the binomial distribution around chance level for patient WH in (A) Experiment 1 (“Motion Identification/ Discrimination”), (B) Experiment 2 (“Biological Motion”) and (C) Experiment 3 (“Shape-from Motion”). The black dots indicate the average percentage of correct responses (CR) and the grey boxes the 95%-confidence interval for the binomial distribution around chance level.

