Figure 1.

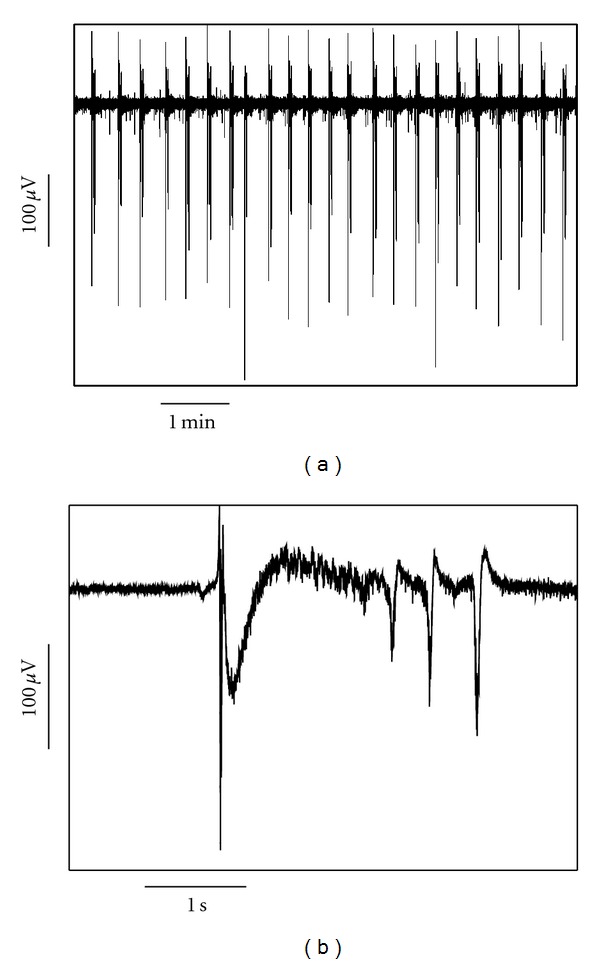
An example from a control WT slice showing the pattern of low-magnesium seizure-like event (SLE) activity. (a) shows a compressed time view and (b) an enlarged view of one SLE.

An example from a control WT slice showing the pattern of low-magnesium seizure-like event (SLE) activity. (a) shows a compressed time view and (b) an enlarged view of one SLE.