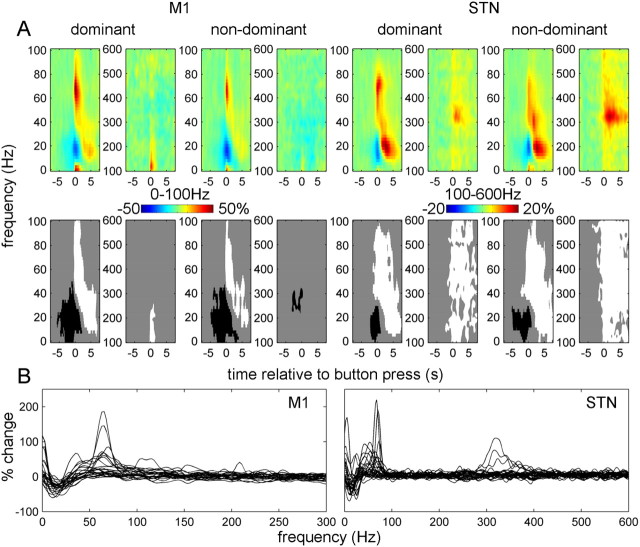
Figure 2.
Power responses induced by the button press in contralateral M1 and STN. A, Average time–frequency images. Induced responses were baseline corrected (baseline −8 to −5 s) and averaged across conditions. Separate t tests were performed for dominant and nondominant hemispheres and for 0–100 and 100–600 Hz ranges (each condition has 2 spectrograms). The top row shows unthresholded mean time–frequency images relating to M1 (leftmost 4 panels) and STN power change (rightmost 4 panels), and the bottom row reports the corresponding significant positive (white) and negative (black) clusters (p < 0.01, cluster-level FWE correction). B, Induced responses of individual hemispheres. The individual responses whose averages are presented in A were averaged between 0 and 1 s relative to the button press. Dominant and nondominant hemispheres are presented together. Note the presence of clear gamma activity in the 40–90 Hz range in many of the individual hemispheres as well as 300–400 Hz activity clearly present in four hemispheres (for details see Table 2).

