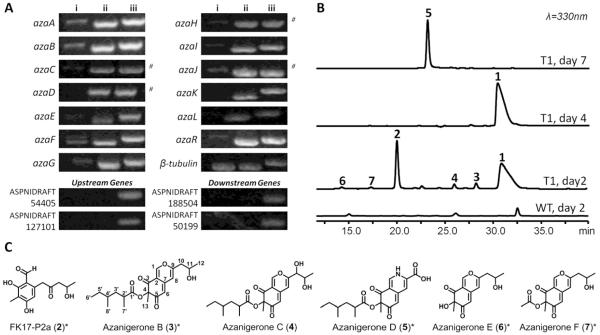
Figure 3.
Activation of the aza pathway via overexpression of azaR. (A) Transcriptional analysis of the aza genes in (i) A. niger WT and (ii) the activated T1 strain by RT-PCR. (ii) PCR from genomic DNA are shown for comparison. # indicates intron-less genes. (B) Time course of A. niger T1 metabolites. Metabolic profiles of the activated A. niger T1 strain on day 2, 4 and 7; and WT profile at day 2 are shown (C) Compounds observed in culture of A. niger T1 strain (see Figure S1). Structures indicated with * are confirmed by NMR (see Tables S1-3 and Figures S6-10). MS/MS analyses of 3 and 4 are in Figures S3-4.

