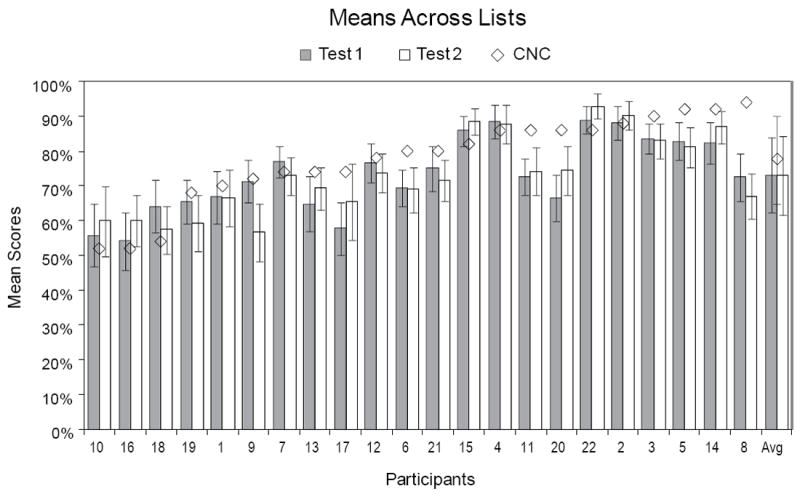
Figure 1.

Mean TIMIT sentence scores in percent correct across lists for each of the 22 participants. Mean scores for Test 1 are displayed as gray bars and for Test 2 as white bars. CNC word scores are shown as the open diamonds. Participants are ranked from low to high on CNC word scores. Average scores across participants are shown to the far right. Error bars are ± 1 standard deviation of the mean.
