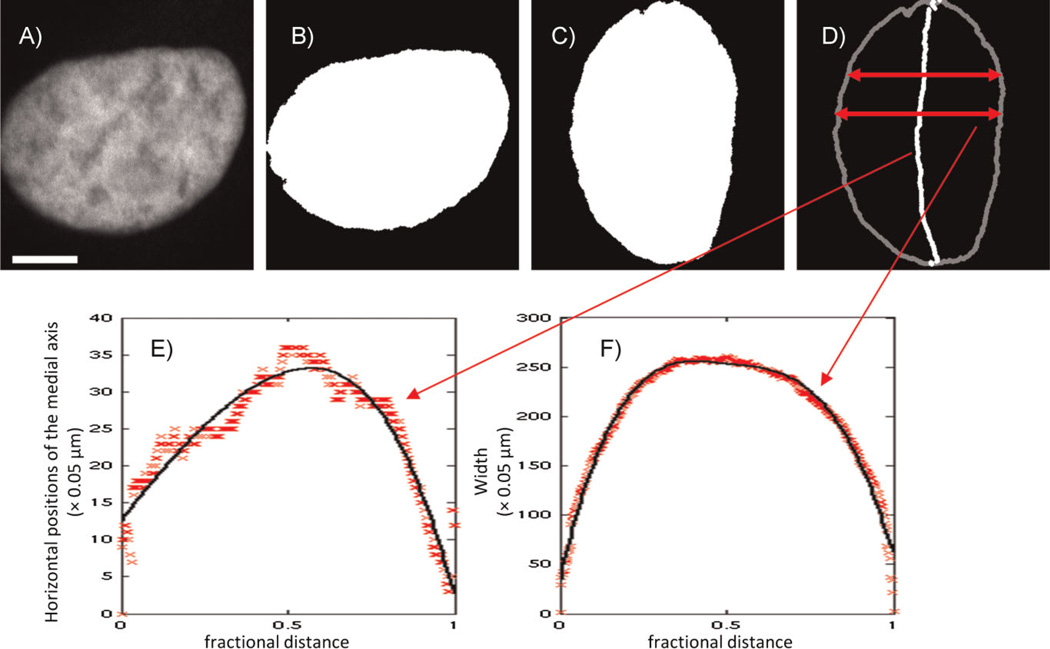
Figure 1.
Illustration of medial axis model fitted by B-splines for nuclear shape. The original nuclear image (A) was processed into a binarized image (B), in which the nuclear object consists of the white area. The nuclear object was rotated so that its major axis is vertical (C) and then converted into the medial axis representation (D). The horizontal positions of the medial axis as a function of the fractional distance along it are shown by the symbols in (E), along with a B-spline fit (solid curve). The width as a function of fractional distance is shown by the symbols in (F), along with the corresponding fit (solid curve). Scale bar: 5 µm. (From [11]).

