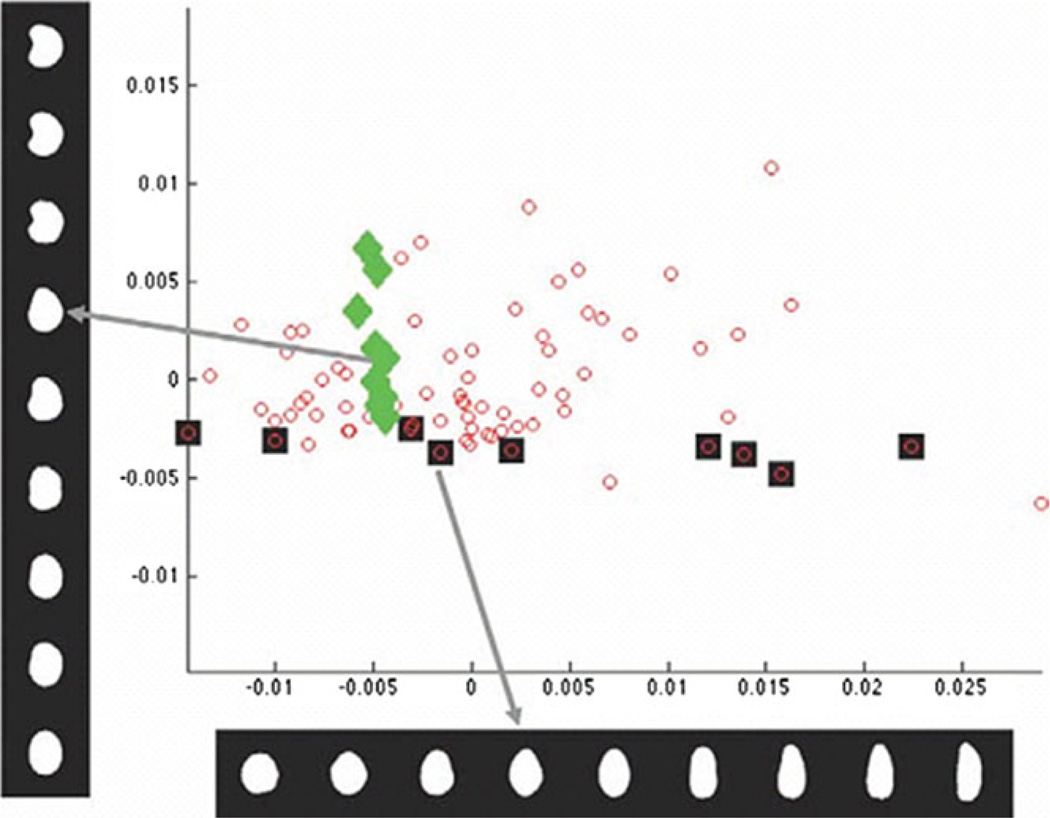
Figure 3.
Plot of the first two components of the low-dimensional representation of the nuclear shape computed by the shape interpolation method discussed in the text. Each small circle corresponds to one nuclear image. Images associated with specific data points are shown on the left (diamonds) or across the bottom (squares). Each dark square corresponds to each image shown in the horizontal bottom series of images. Likewise, each light diamond corresponds to each image stacked vertically. Note that the method separates different modes of shape variation (bending and elongation) into separate coordinates (vertical and horizontal) (from [7]).

