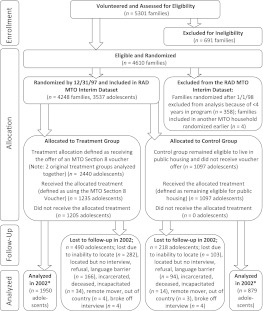
FIGURE 1.
MTO youth enrollment, treatment allocation, and attrition. * 2002 Interim Survey yielded 89% effective response rate (RR) with a 2-stage follow-up sampling strategy, calculated as RR = MRR + SRR * (1 − MRR), where MRR = response rate for main sample (respondents initially responding to 2002 survey interview request) and SRR = response rate for subsample (a second attempt to find every 3 in 10 hard-to-reach families initially nonresponsive in 20028; see p. A-8 of MTO Interim Evaluation [Orr et al, 2003].8).

