Figure 3.
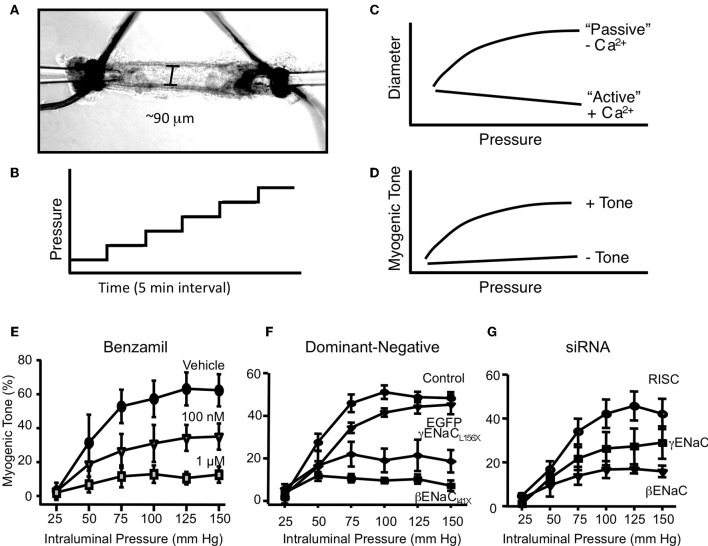
In vitro assessment of myogenic constriction. (A) Image of an isolated renal interlobar artery segment tied to inflow and outflow perfusion pipettes. (B) To assess myogenic responsiveness vessels are exposed to a step-wise increase in perfusion pressure (25 mm Hg step, 5 min each) from 25 to 150 mm Hg under normal external Ca2+ and Ca2+ free solutions to determine active response and passive responses, respectively (C). (C) The steady state diameter is plotted vs. pressure to obtain a pressure-diameter relationship under active vs. passive conditions. (D) Myogenic tone is calculated as [(passive diameter – active diameter)/passive diameter] at each pressure step. A vessel with active myogenic tone will have an increase in tone with an increase in pressure. A vessel with reduced or absent myogenic tone will have a flattened relationship between pressure and tone. (E) Effect of ENaC inhibition with benzamil on myogenic tone in renal interlobar arteries. (F) Transient gene-silencing of βENaC or γENaC using dominant-negative constructs of βENaC or γENaC inhibits myogenic tone in renal interlobar arteries. (G) Transient gene-silencing of βENaC or γENaC using siRNA inhibits myogenic tone in renal interlobar arteries. (Figure reproduced from American Journal of Physiology, Renal Physiology 289; F891-F901, 2005, Figure 4 and American Journal of Physiology, Renal Physiology 291; F1184–F1191, 2006, Figures 5, 6).

