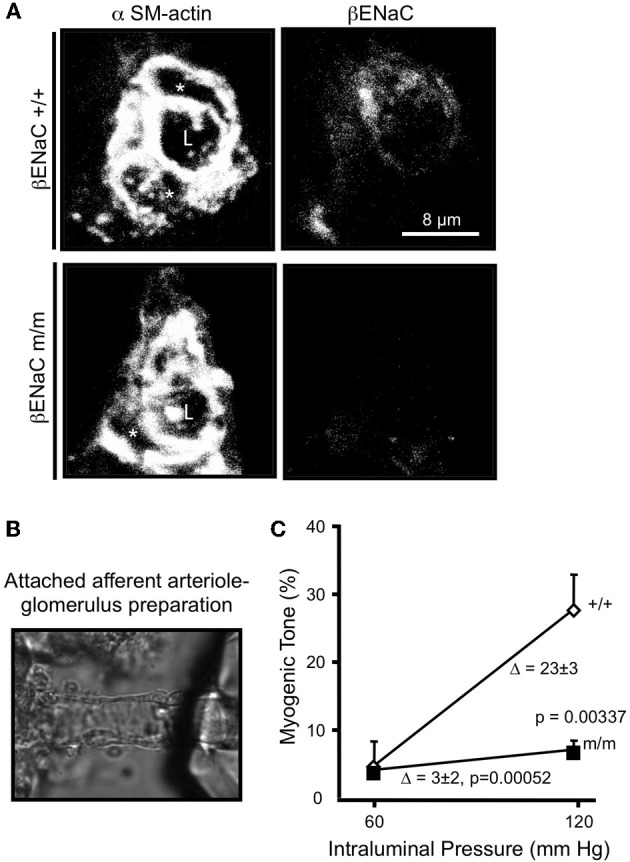
Figure 4.

Localization of βENaC and contribution to myogenic constriction in renal afferent arteriole. (A) Localization of SM α-actin (left) and βENaC (right) in a cross-sectional image of a renal arteriole from a βENaC +/+ (top) and m/m (bottom) mouse. In the merged image, an “L” identifies the arteriolar lumen and an asterisk (*) identifies the VSMC cell bodies. (B) Image of an isolated afferent arteriole with attached glomerulus preparation. (C) Steady state vasoconstrictor responses to an increase in pressure in afferent arterioles in βENaC +/+ and m/m animals (n = 6). Vasoconstrictor responses to adrenergic agonist norepinephrine (NE) were similar (not shown). (Figure reproduced from American Journal of Physiology, Renal Physiology 302; F1486–F1493, 2012, Figures 1, 2).
