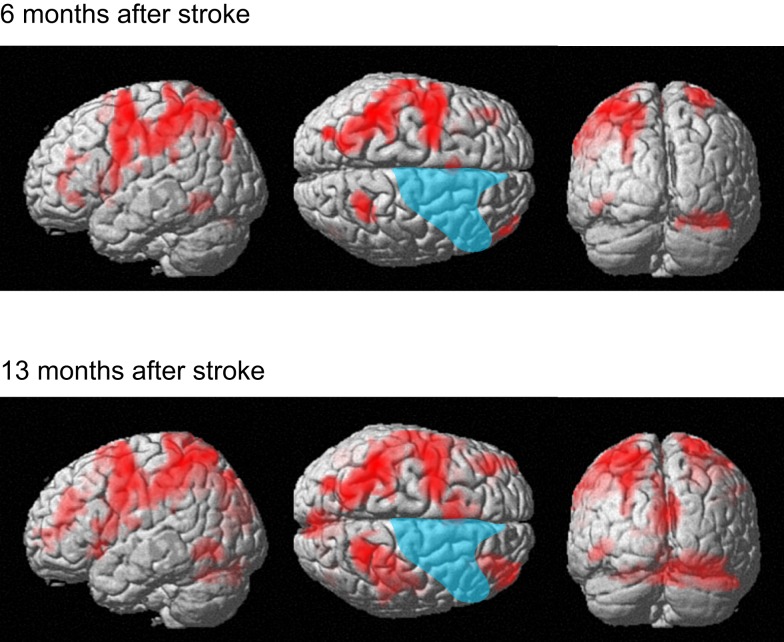
Figure 7.
Active areas during the delay period on the digit memory task relative to these during the visual fixation condition 6 and 13 months after her stroke. The blue region indicates the lesion area. Brain activity is overlayed on the spatially normalized rendering images (voxel level, p < 0.001 uncorrected for multiple comparison; cluster level p < 0.05 FWE). The detailed coordinates and statistical values are listed in Table A2 in Appendix online.

