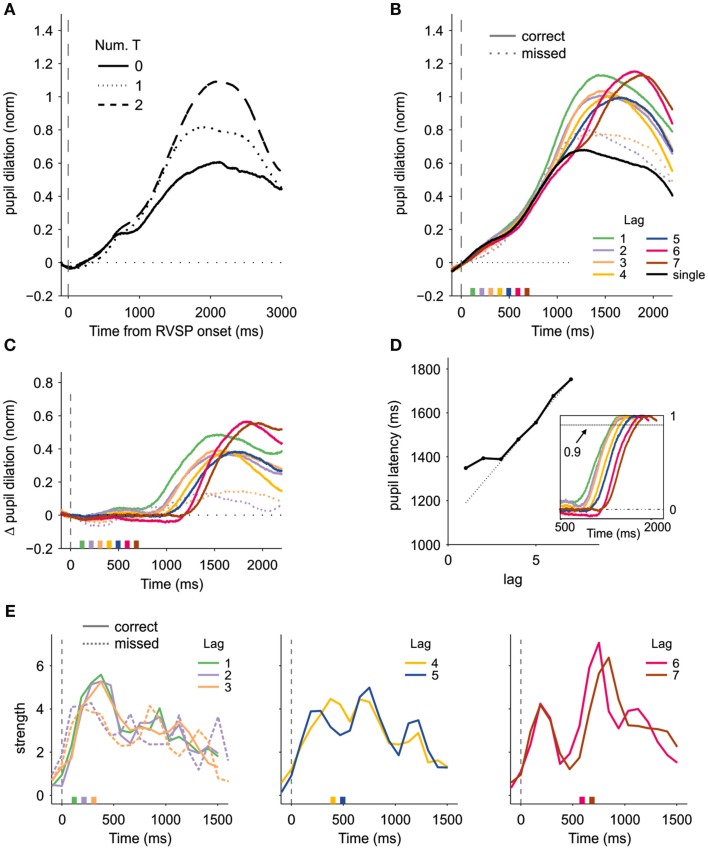
Figure 2.
Pupil dilation and the timing of attention. (A) Normalized pupil dilation as a function of the number of reported targets, locked to the onset of the RVSP. (B) Pupillary response as a function of lag and accuracy, aligned to the onset of the first target. The dashed line shows the time course of the pupil dilation for missed T2, for lags 2 and 3. The solid black line shows the response when only one target was presented. The boxes at the bottom of the graph indicate the onset of the second target. (C) Same as in (B), after subtracting the pupil size when only one target had to be reported. (D) Latency of the pupil response (arbitrarily defined as the point in the where the dilation reached 90% of its peak) as a function of lag, showing that the pupil dilation is protracted at short lags. Pupil latencies are shown relative to the onset of T2. The dashed line indicates the expected latency if the pupillary responses were time-locked to T2: a good predictor of the actual latency only at long lags. The inset shows the pupillary response [as in (C)] divided by the peak response at each lag. (E) Strength of the attentional pulses obtained after deconvolving the pupillary response with an impulse response function following the method introduced in (Wierda et al., 2012). Solid lines correspond to correct trials, and dashed lines to blinked trials (only for lags 2 and 3).

