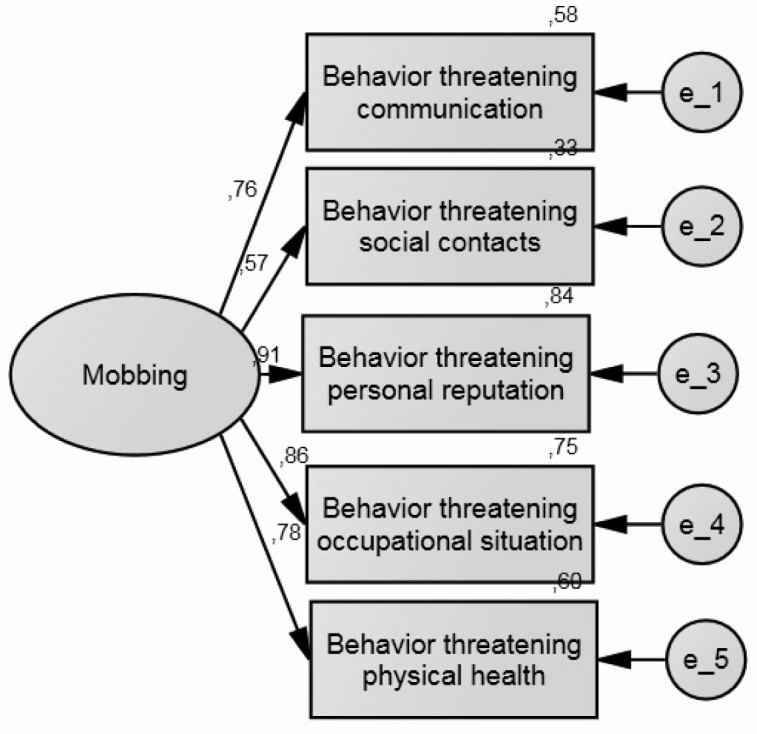
Figure 1.

The measurement model identifying physicians’ exposure to mobbing behavior. χ2/df = 12.865/5 = 2.573; normed fit index = 0.984; Tucker Lewis index = 0.980; comparative fit index = 0.990; and root mean square error of approximation = 0.075. Rectangles represent independent and indicator variables and ellipses represent latent variables. The arrows from latent variables to indicators show regression and indicator weights. The error for each variable is represented by the arrow pointing to the variable and “e” in the circle. These errors correspond to the errors in the indicator variables.
