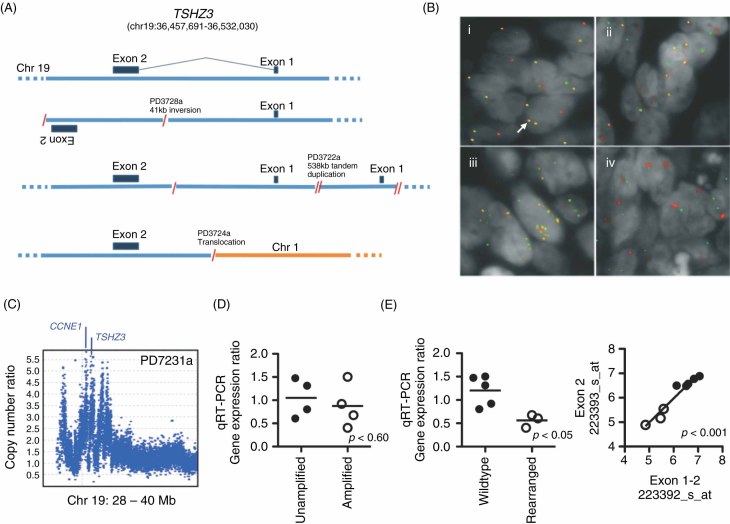
Figure 2.
(A) Wild-type TSHZ3 locus (top) and schematics of the three rearrangements identified by next-generation sequencing. (B) Tissue microarray images of four cases with varying TSHZ3 rearrangements: (1) loss of the 5′ end of TSHZ3 with example of locus without rearrangement indicated by a white arrow; (ii) balanced break; (iii) amplification; and (iv) breakage with amplification of the 3′ end of TSHZ3. Green, BAC probes RP11-280H11 and RP11-241C16 (5′ TSHZ3); red, RP11-161K19 and RP11-164O11 (3′ TSHZ3). (C) Affymetrix SNP 6.0 copy number data for tumour sample PD7231a, showing multiple focal amplifications incorporating CCNE1 and TSHZ3. (D) Scatter plot of TSHZ3 expression by gene copy number status, where amplification is > three copies. (E) Scatter plot showing TSHZ3 gene expression by qRT–PCR (left) and gene expression microarray (right) in rearranged tumours (open circles) compared to samples without gene rearrangement (closed circles)

