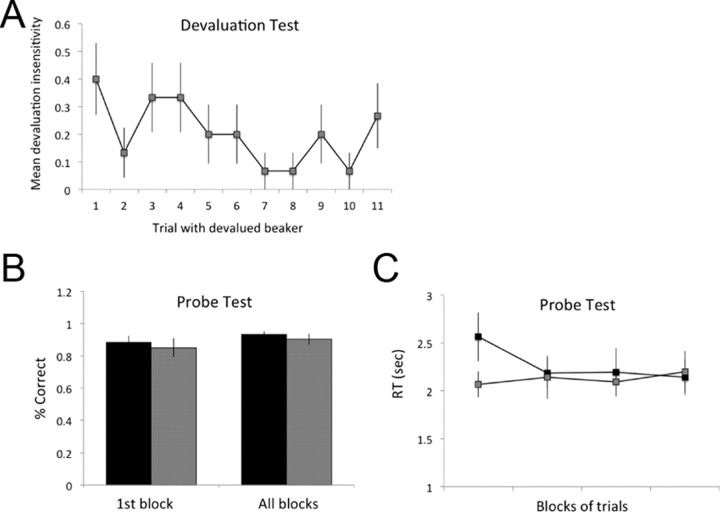
Figure 3.
Behavioral results from the devaluation and probe tests, shown for the C-R (gray) and R-O (black) conditions. A, Mean responding, across subjects, in the C-R condition, on each trial with the devalued beaker. B, Mean accuracy on the probe test on the first trial with each action (first block) and across all blocks. C, Mean response times (from cue onset to last element in response sequence) in each block of the probe test for the C-R and R-O conditions. Error bars are SEM.

