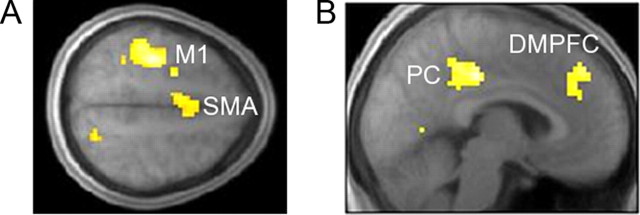
Figure 6.
Neural activations for tests of changes across blocks of observational learning trials. A, Map of the statistics for the conjunction test of linearly decreasing activity across training blocks in both conditions, showing effects in the supplementary motor area (SMA), left M1, and left postcentral gyrus. B, A test for decreasing activity across blocks in the R-O condition and increasing activity across blocks in the C-R condition revealed effects in the DMFC and posterior cingulate (PC).

