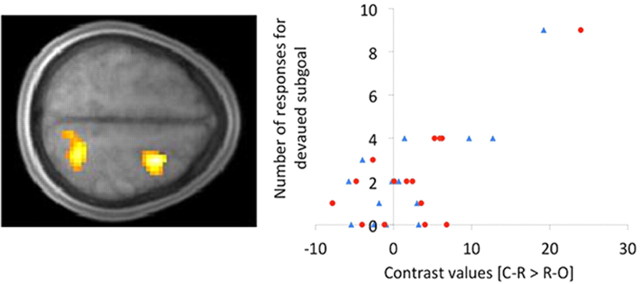
Figure 7.
Correlation between the difference in devaluation insensitive performance (i.e., responding to fill up the devalued beaker) across the C-R and R-O conditions and the BOLD response to the [C-R > R-O] contrast during observational learning. Effects were found in the SPL and dorsal premotor (dPM) cortex (left). Scatter plot (right) shows devaluation insensitive performance in the C-R condition as a function of [C-R > R-O] contrast values in the SPL (blue triangles) and dPMC (red circles), estimated at LOSO coordinates.

