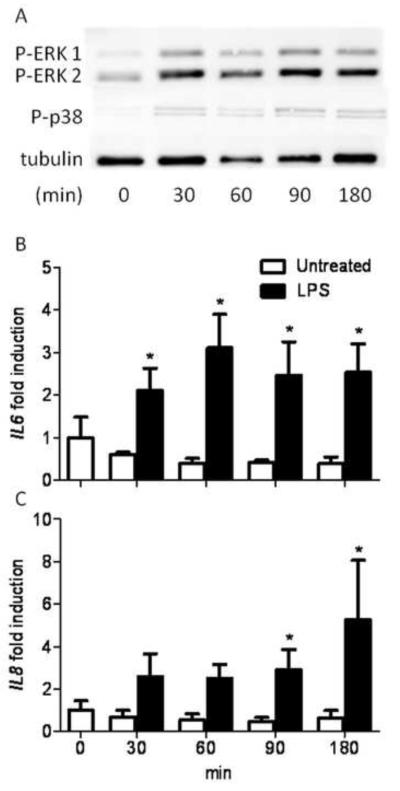
Figure 3. LPS induced phosphorylation of ERK and p38, and IL6 and IL8 gene expression in granulosa cells in a time-dependent manner.
(A) Granulosa cells were treated with 1 μg/ml of ultrapure LPS and cultured for 30, 60, 90 or 180 min before Western blot analysis. Bands are shown corresponding to di-phosphorylated ERK 1/2, phosphorylated p38 (Thr180/Tyr182) and tubulin as a loading control. Image is representative of 3 independent experiments. Granulosa cells were cultured in control medium (□) or medium containing 1 μg/ml of ultrapure LPS (■) for 30, 60, 90 or 180 min and the IL6 (B) and IL8 (C) gene expression was measured using real time RT-PCR. Data are represented as mean + SEM fold induction compared with control cells at time 0 from 4 independent experiments. * P < 0.05 compared to untreated control within time points; analysis by non-parametric Mann-Whitney U test.

