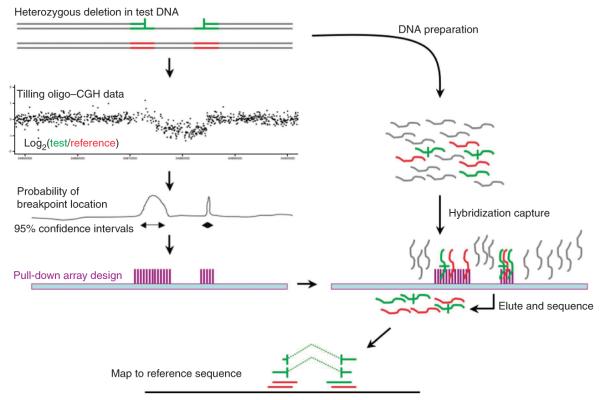
Figure 1.
Experimental overview. This diagram depicts the three stages of the experiment. First, test (green) and reference (red) DNAs are cohybridized to a CGH array. Second, the intensity data generated from the CGH experiment is summarized at each probe and the distribution of probe intensities is used to identify CNVs using the GADA segmentation algorithm18. The intensity data are then used to construct confidence intervals around each putative CNV breakpoint. A hybridization-based capture array is designed to these confidence intervals. Third, test and reference samples are cohybridized to the capture array. Fragments with at least partial homology to the target regions are preferentially retained and sequenced. Sequence reads are mapped to the genome; reads without CNV breakpoints show contiguous homology to the reference across all bases, whereas reads containing breakpoints appear to be split, with partial homology to either side of the CNV.

