Figure 4.
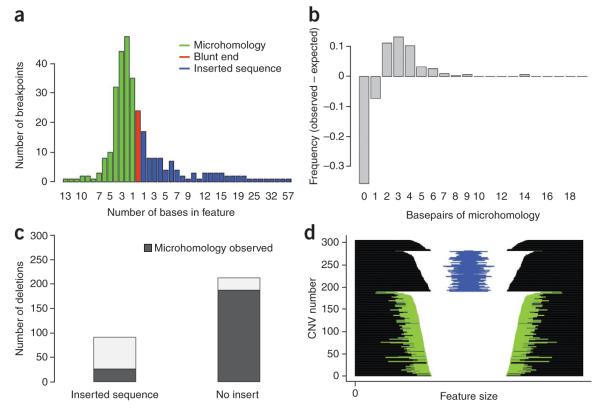
Summary of sequence content at deletion breaks. (a) Histogram summarizing the number of breakpoints showing blunt ends (red), microhomology (blue) or inserted sequence (red). For each class of breakpoint, events are binned by the number of bases in each feature; in the case of blunt ends, all events are in the same bin of 0 bases. (b) Nonrandom distribution of microhomology observed at deletion breakpoints. We derived an expected distribution of microhomology length by simulating random breakpoints while conditioning on the base content of CNV breakpoint regions. Here we have plotted the difference between the observed and expected amount of microhomology for our deletion breakpoints, which reveals two notable features of our data: (i) there are more deletion breakpoints showing microhomology than expected by chance; (ii) conditional on the presence of microhomology, there is an enrichment of breakpoints with 2–9 bases of microhomology. (c) The presence of inserted sequence within deletion breakpoints is more common in the absence of microhomology (P < 10−15, χ2 test). (d) Each deletion sequenced in the pulldown experiment is represented with a horizontal line. The deletions are parsed by sequence features into three groups: the top group shows no microhomology or inserted sequence, the second group shows at least 1 bp of inserted sequence, represented by a blue line, and the third groups shows at least 1 bp of microhomology at the breakpoints, represented by green lines. CNVs and sequence features are plotted on a log scale, and CNVs are sorted by size within groups.

