Figure 4.
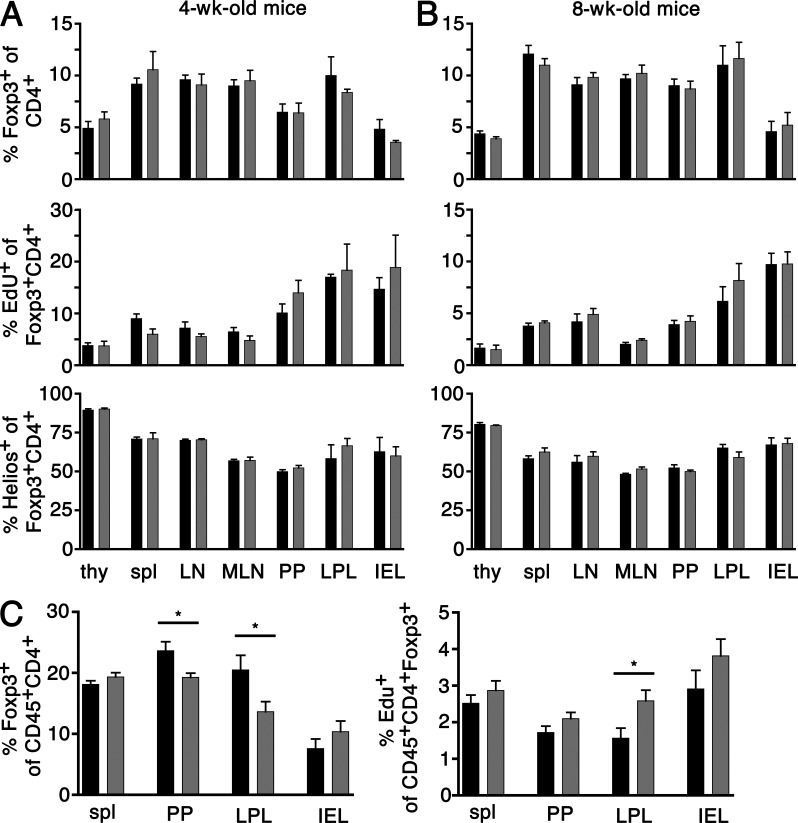
Analysis of T reg cell frequencies, proliferation rate, and proportion of Helios-expressing T reg cells in adult males. 4-wk-old (A), 8-wk-old (B), and 6-mo-old (C) males have been injected with 1 mg EdU i.p. 16 h before analysis. (A and B) Thymi (thy), spleen (spl), axial/inguinal LN, MLN, PP, LPL, and IEL have been analyzed for frequency of Foxp3+ T reg cells among CD4+ T cells (top), EdU+ (middle), and Helios+ (bottom) cells among T reg cells. Data are representative of two to six males and two to three independent experiments per group. (C) Frequencies of T reg cells (left) and EdU+ T reg cells (right) were assessed in spleen, PP, LPL, and IEL. Data are representative of 7–10 males and five independent experiments per group. Data for foxp3WT mice are depicted in black and data for foxp3CNS1mut mice are depicted in gray. Error bars indicate means ± SEM. *, P < 0.03.

