Figure 10.
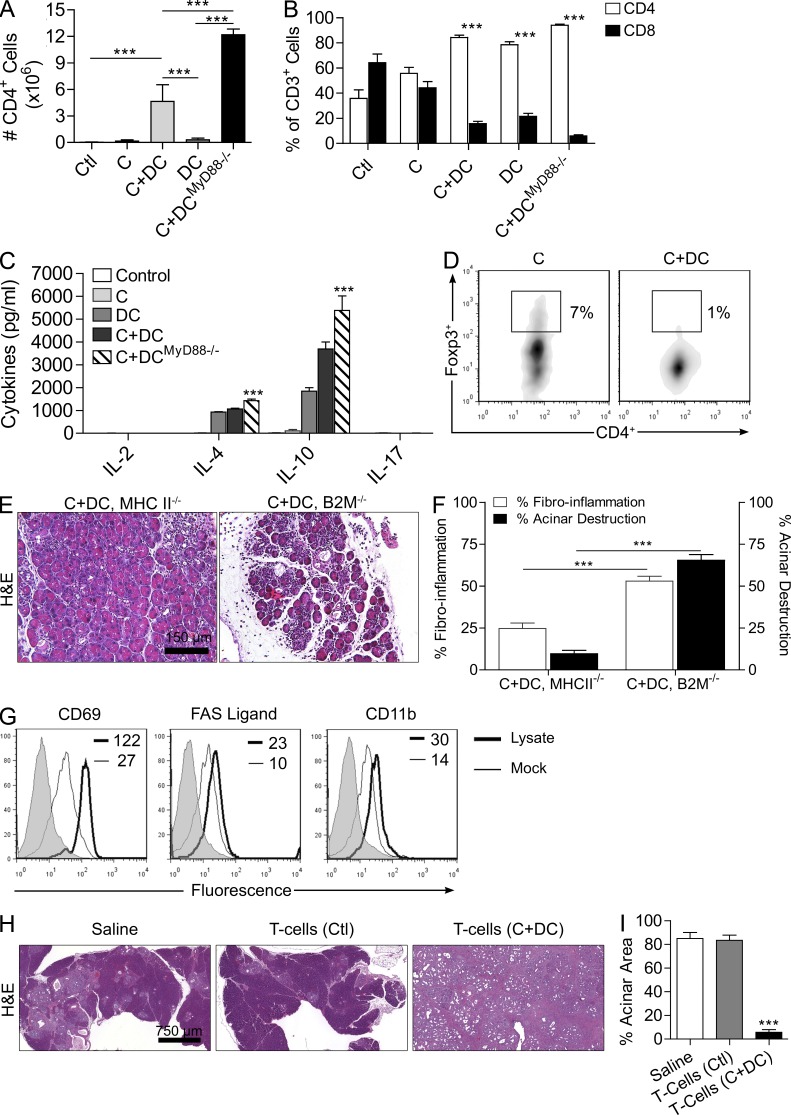
DCs exacerbate pancreatic disease by inducing antigen-restricted Th2 cells. (A and B) The total number of CD4+ cells in the pancreata of mice treated with C+DCWT, C+DCMyD88−/−, and controls (A) and the fraction of intrapancreatic CD4+ or CD8+ T cells among all CD3+ cells (B) were measured by flow cytometry (***, P < 0.001). (C) CD4+ T cell differentiation in the pancreas of mice treated with C+DCWT, C+DCMyD88−/−, and controls was determined by measuring their production of Th1, Th2, and Th17 cytokines after FACS sorting. (D) The fraction of intrapancreatic Treg cells was determined by gating on CD45+CD25+ leukocytes and cross staining for CD4 and Foxp3. In vitro assays were repeated three times with similar results. (E and F) MHC II−/− and β2-microglobulin−/− mice treated with caerulein were recipients of DC transfer. A mean of four mice per group was used in these experiments (***, P < 0.001). (G) To determine the pancreatic antigen specificity of effector T cells, FACS-sorted pancreas-infiltrating CD4+ T cells from WT C+DC-treated mice were cultured with pancreatic lysate– or mock-pulsed DCs. CD4+ T cell activation was then determined by their expression of CD69, FAS ligand, and CD11b. Gray histograms represent isotype control. Median fluorescent indexes are shown for each group. Experiments were repeated three times with similar results. (H and I) p48Cre;KrasG12D mice were adoptively transferred for 5 wk with CD4+ T cells derived from control and C+DC-treated mice (n = 3/group). Representative H&E-stained sections and images of pancreata are shown (H), and the fraction of pancreatic area with preserved acinar architecture was measured (I; ***, P < 0.001). Error bars indicate standard error of the mean.

