Figure 8.
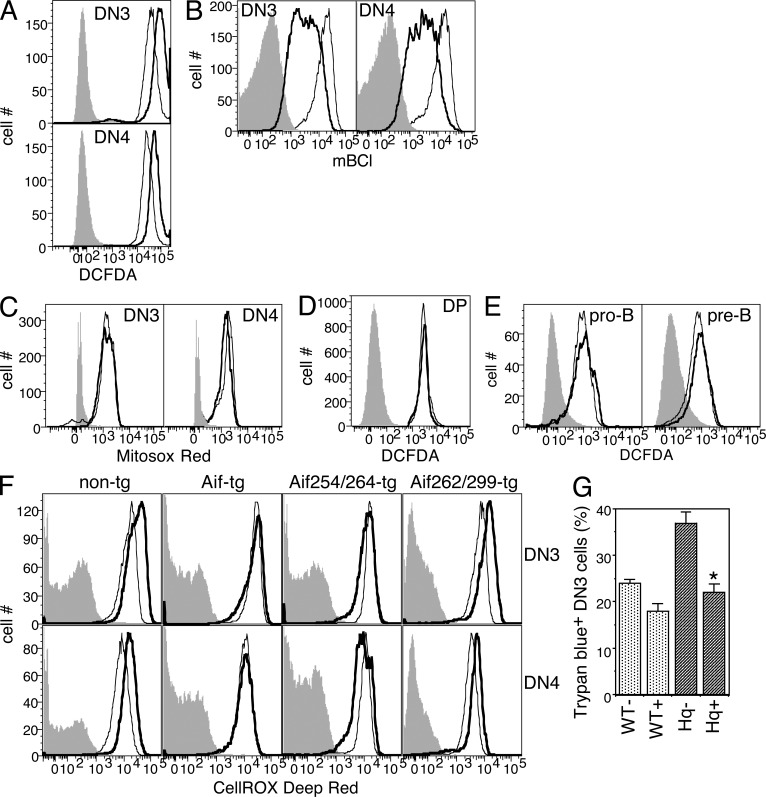
Increased ROS levels are involved in the thymic hypocellularity of Hq mice. (A–C) Representative histogram overlays of gated DN3 and DN4 thymocytes from WT (thin lines) or Hq (thick lines) mice stained with DCFDA (A), mBCl (B), or MitoSOX red (C) as indicated. Filled histograms represent isotype controls. (D) Representative histogram overlays of gated DP thymocytes from WT (thin lines) or Hq (thick lines) mice stained with DCFDA. Filled histogram represents negative control. (E) Representative histogram overlays of gated B220+CD43+IgM− pro–B or B220+CD43−IgM− pre–B cells from bone marrow of WT (thin lines) or Hq (thick lines) mice stained with DCFDA. Filled histograms represent negative controls. (F) Representative histogram overlays of gated DN3 and DN4 thymocytes from WT (thin lines) or Hq (thick lines) mice which were non-tg, Aif tg, Aif254/264 tg, or Aif262/299 tg as indicated, stained with the ROS indicator dye CellROX Deep Red. Filled histograms represent negative controls. Data represent three to eight independently tested littermate pairs. (G) DN3 thymocytes from WT or Hq mice as indicated were electronically sorted and put in culture in vitro for 8 h with (−) or without (+) Euk-134 as indicated, and the frequencies of dead cells were estimated by Trypan blue staining. Data are shown as mean ± SE (n = 3) *, P < 0.01. All data are representative of at least two independent experiments.

