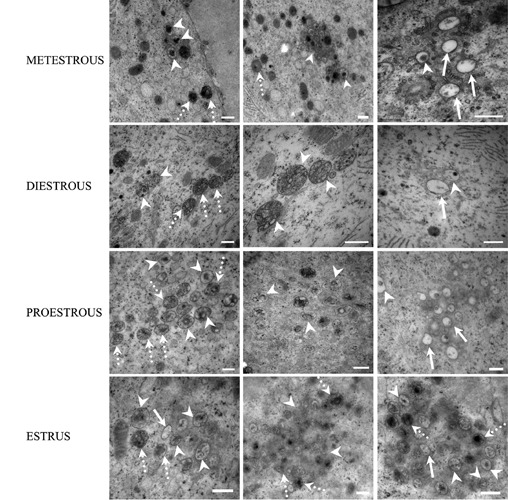
Figure 12.

Electron micrographs of the cytoplasm of atretic oocytes of adult rats showing autophagic vesicles in different degrees of degradation in all phases of the estrous cycle. Dotted arrows indicate autophagic vesicles in the initial phase of degradation; arrowheads show autophagosomes with an intermediate stage of degradation of their content. Arrows point to clear vesicles containing material in the last phase of autophagic degradation. Scale bars: 500 nm.
