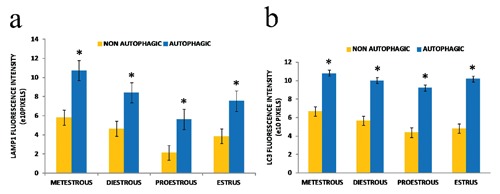
Figure 3.

Quantification of the fluorescence intensity of Lamp1 (a) and LC3 (b). There is a significant difference in the intensity of the immunodetection of these two proteins between autophagic and non-autophagic cells. Error bars represent standard error and the asterisk indicate the significant differences obtained by a Student t-test (P<0.05).
