
Figure 1.
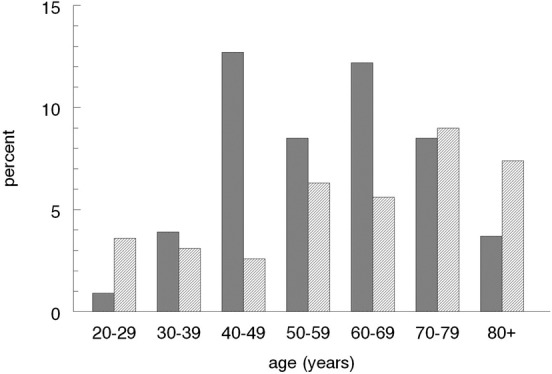
Age and gender distribution in individuals with daily or frequent symptoms of cough. Data presented in percentage of the total population. Dark bars = females.
Official websites use .gov
A
.gov website belongs to an official
government organization in the United States.
Secure .gov websites use HTTPS
A lock (
) or https:// means you've safely
connected to the .gov website. Share sensitive
information only on official, secure websites.
Age and gender distribution in individuals with daily or frequent symptoms of cough. Data presented in percentage of the total population. Dark bars = females.