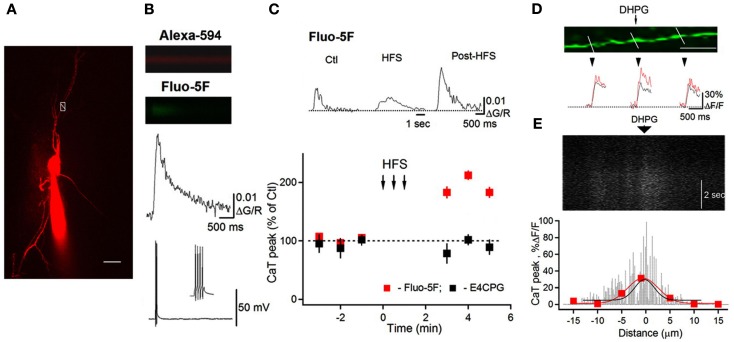
Figure 2.
Potentiation of bAP–CaTs in interneuron dendrites. (A) Two-photon image of an O/A interneuron filled with Alexa 594 and Fluo-5F. White box with a line across the dendrite indicate the position of the line scan to measure bAP–CaT shown in (B). Scale bar, 20 μm. (B) Line scan images and associated bAP–CaT. (C) Representative bAP–CaTs evoked before (Ctl) during (middle traces; HFS) and after high-frequency synaptic stimulation (post-HFS) within the same dendritic region, and a summary plot, indicating a significant post-HFS potentiation of bAP–CaTs. HFS-induced AP–CaT potentiation was prevented by the mGluR1/mGluR5 antagonist E4CPG. (D) Magnified image of a dendrite with lines indicating locations for bAP–CaT measurements. Scale bar, 10 μm. Traces below show bAP–CaTs obtained from these locations in control (black) and after DHPG application (100 μM; red). (E) Line scan image collected along the middle part of the dendrite shown in (D) and demonstrating a slow DHPG Ca2+ response with corresponding spatial profile histogram (black fit). For comparison, the spatial profile of potentiated bAP–CaT (red) obtained from this region is shown superimposed. Modified from Topolnik et al. (2009) with permission.

