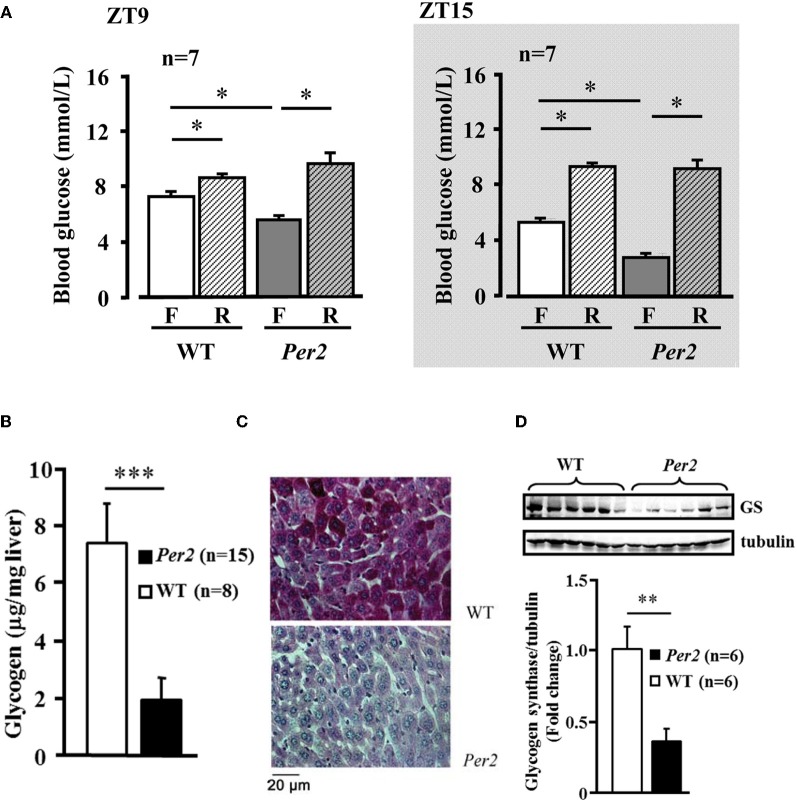
Figure 4.
Decreased fasting plasma glucose concentration and hepatic glycogen content in mPer2Brdm1 mice. (A) Decreased fasting (F) blood plasma glucose concentration in the mPer2Brdm1 mice as compared to WT littermates at ZT9 and ZT15, which is normalized after refeeding (R). (B) Fasting hepatic glycogen content of WT and mPer2Brdm1 mice at ZT9. (C) Representative Periodic Acid-Schiff (PAS) staining showing hepatic glycogen contents in WT and mPer2Brdm1 mice. (D) Immunoblotting showing fasting hepatic glycogen synthase (GS) levels in WT and mPer2Brdm1 mice. *p < 0.05, **p < 0.01, and ***p < 0.005 between the indicated groups, respectively.

