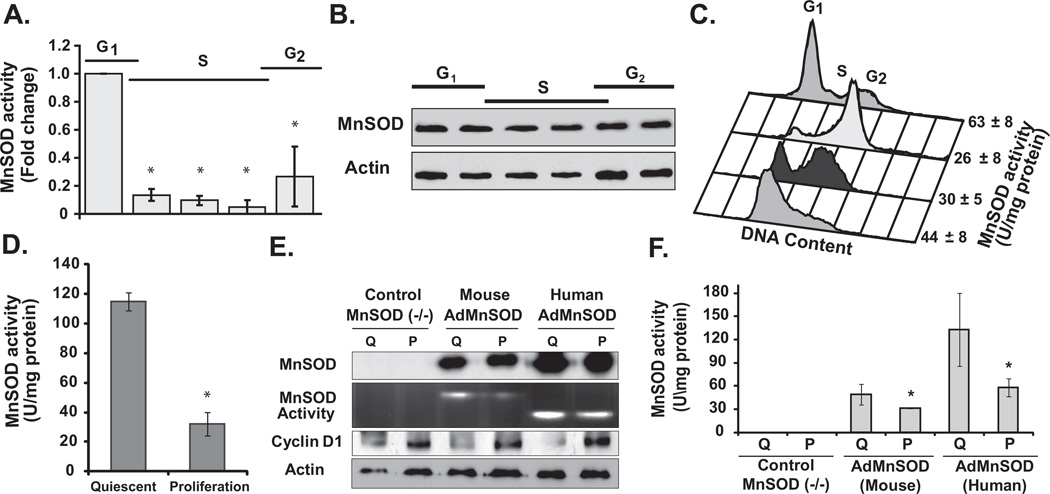
Figure 4. Periodic change in MnSOD activity during the cell cycle.
Synchronized MEFs were harvested at different times post-replating, and analyzed for MnSOD (A) activity and (B) protein levels. Cells in replicate dishes were used for flow cytometry measurements of cell cycle phase distributions. (C) Representative histograms of DNA content exhibiting cell cycle phase distributions when cells in replicate dishes were harvested for biochemical measurements of MnSOD activity: MB231 cells at the time of release from the thymidine block, and later in S- and G2-phase. Cells in G1-phase of the daughter generation were collected at 4 h post-mitotic shake-off. (D) MnSOD activity in quiescent and proliferating MCF10A cells. Asterisk indicates statistical significance in MnSOD activity relative to quiescent cells; n = 3, P <0.05. (E) Quiescent (Q) and proliferating (P) cultures of MnSOD (−/−) MEFs were infected with 50 MOI of adenoviruses carrying CMV-promoter driven mouse or human MnSOD cDNA; immunoblotting assay to determine protein levels of MnSOD, cyclin D1, and actin. A gel-electrophoresis-based method was used to measure MnSOD activity. (F) Cells from replicate dishes were harvested for a spectroscopy-based assay to measure MnSOD activity. Asterisk indicates statistical significance in MnSOD activity relative to quiescent (Q) cultures; n = 3, P <0.05.

