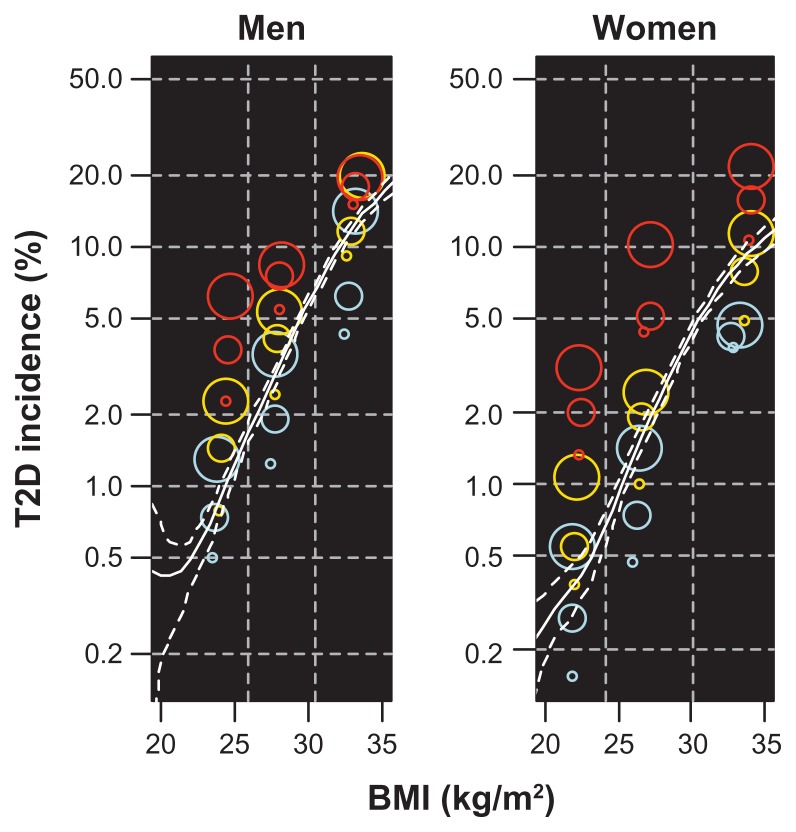
Figure 2.
Incidence of T2D by BMI, triglycerides, and diastolic blood pressure.
Notes: Colored points: Incidence in 27 groups defined by the 50% and 90% quantiles of BMI, triglycerides, and blood pressure, by gender. BMI groups are distinguished by vertical dashed lines, triglyceride groups by color (blue, orange, and red indicate increasing levels), and blood pressure group by point size (increasing size for increasing levels). The x-coordinate of each point indicates the mean BMI in the corresponding BiTjDk group. White lines: smoothing spline estimate of incidence of T2D by BMI only, with 95% bootstrapped confidence band.
Abbreviations: BMI, body mass index; T2D, type 2 diabetes.

