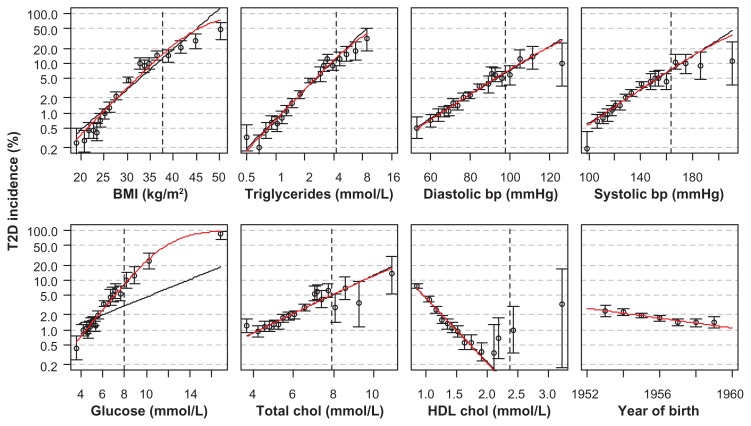
eFigure 4.
Incidence of T2D for women in groups defined by the 1, 5, 15, 25, 35, 45, 55, 65, 75, 85, 95, 96, 97, 98, 99.5, 99.8, and 99.95% quantiles of the actual variables, with 95% binomial confidence intervals.
Notes: The x values for the points equal the means of the groups. A vertical dashed line is drawn at the 99% quantile for each variable. The curves show the fits of Poisson (black) and logistic (red) regressions. Triglycerides were log-transformed in the regressions. The data were similar for men.
Abbreviations: BMI, body mass index; bp, blood pressure; chol, cholesterol; T2D, type 2 diabetes; HDL, high-density lipoprotein.

