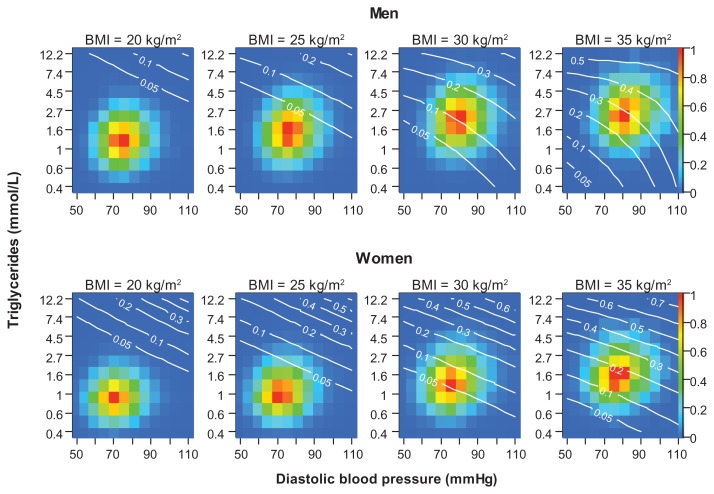
eFigure 5.
Predicted probability (white curves/numbers) for developing T2D before age 60 years for a 42-year-old man (top) and woman (bottom) with BMI equal to 20, 25, 30 or 35 kg/m2 at given levels of triglycerides and blood pressure.
Notes: The color of each cell indicates the number of individuals in the study population with the given level of triglycerides and blood pressure according to the color scale on the right y axes. Blue cells (value 0) have zero individuals, and at each level of BMI the red cell (value 1) is the most common combination of triglycerides and blood pressure. An orange cell (value 0.8) has 20% less individuals than the red cell in the same plot. The probabilities were predicted from the fit of a multivariate logistic regression model to 175,079 men and 194,897 women participating in the health studies between 1985 and 1999. The variables included were BMI, triglycerides, and diastolic blood pressure (with interaction terms) and year of birth and year of screening (without interaction terms).
Abbreviations: BMI, body mass index; T2D, type 2 diabetes.

