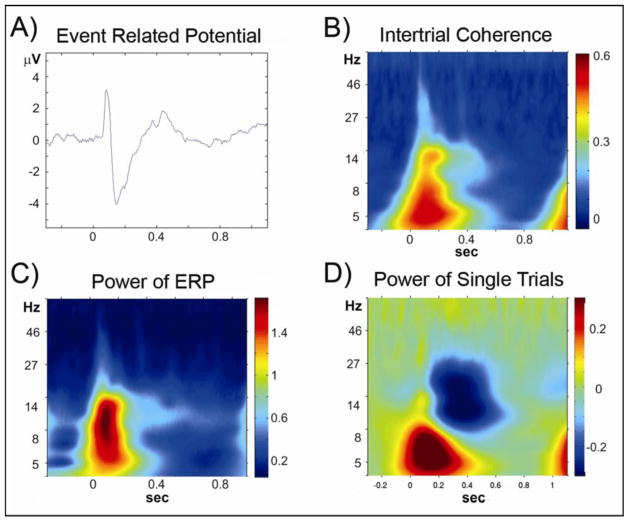
Figure 1. Sensory window.
Analyses of data from the period following Cue A in the AX70 task variation, from the average of electrodes PO3 and PO4, which showed the largest sensory event-related potential amplitudes. The graphs show activity time locked to cue stimulus onset (time = 0). A) Group averaged event related potential to cue onset; B) Time-frequency plot of the intertrial coherence; C) Time-frequency plot of the power of ERP; D) Time-frequency plot of the power of single trials. Most of the activity in the theta and alpha frequency ranges, in the first 200 ms after stimulus onset, represents the evoked potential (A–C); in addition, there was modulation in alpha and beta frequency range not phase locked to stimulus presentation (D).

