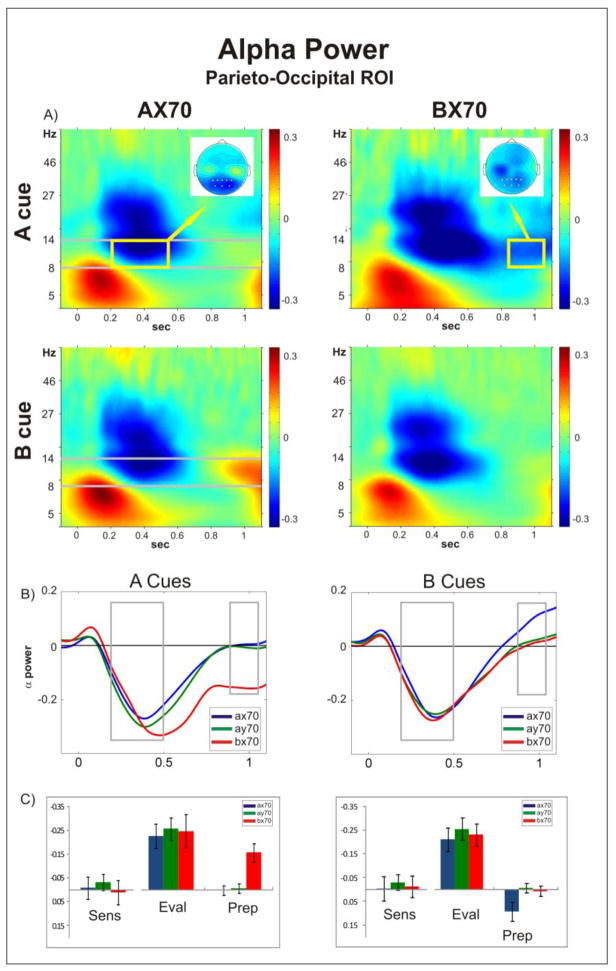
Figure 2. Alpha Power.
A) Time-frequency plots of oscillatory power following A (top) and B (bottom) cue onset (time = 0), for task AX70 (left) and BX70 (right) averaged across the channels over parieto-occipital area that were used for statistical analysis (Pz, P3, P1, P2, P4, POz, PO4, PO3, marked in yellow on the top view insets of the spatial distribution of the alpha activity); B) Comparison of the temporal evolution of alpha power (delimited in grey in A) in all tasks for cues A (left) and B (right). The initial alpha ERD returned to baseline in most tasks, but remained suppressed following the A cue in BX70 (left panel). In addition, following the B cue ERS was observed in task AX70 preceding onset of the target (right panel). C) Histograms showing mean power (+/− standard error) in the alpha range for the three periods analyzed (Sens: sensory; Eval: evaluation; Prep: preparatory), for the three task variants.

