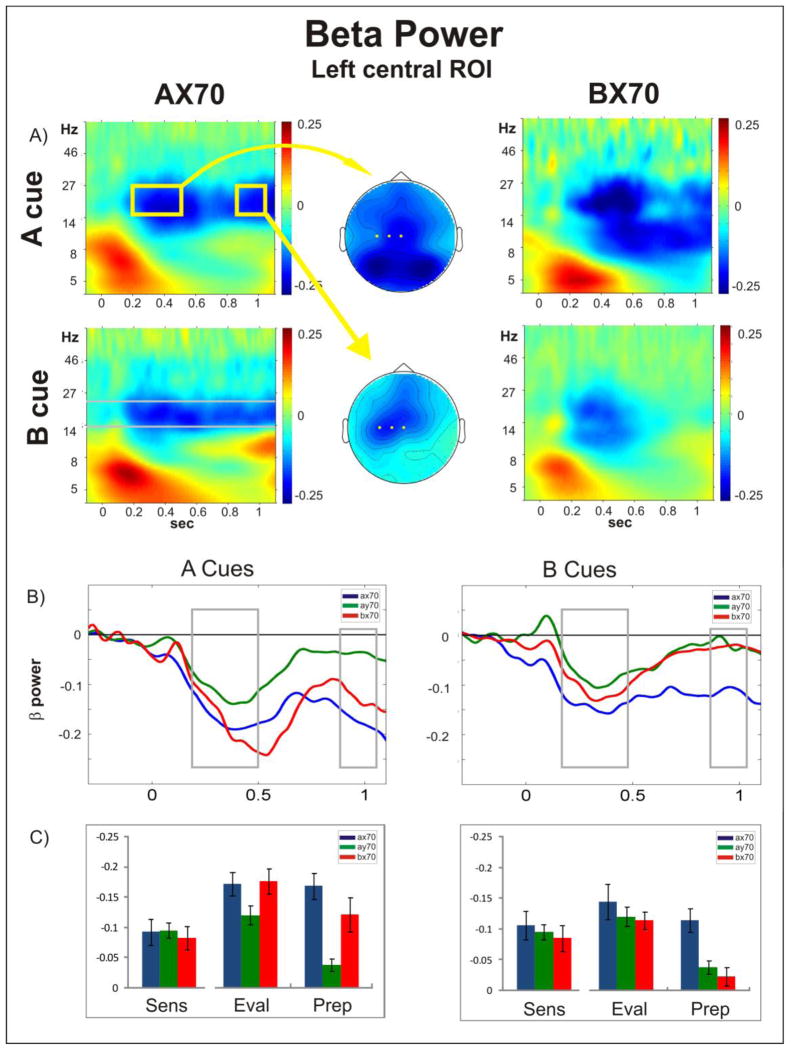
Figure 3. Beta Power.
A) Time frequency plots of oscillatory power following A (top) and B (bottom) cue onset (time = 0), for task AX70 (left) and BX70 (right) averaged across the channels over left somato-motor cortex that were chosen for statistical analysis (C3, C1, Cz). The middle column shows the top view of the spatial distribution of the beta power in the evaluation (top) and preparation (bottom) window following A cues in task AX70, as highlighted by the yellow boxes, with the electrodes used on the ROI statistical analysis highlighted in yellow; B) Comparison of the temporal evolution of beta power (frequencies within the grey bars in A) in all tasks for cues A (left) and B (right). Time zero refers to cue onset. Following an initial dip of beta power in the evaluation period in all tasks, beta remains suppressed in tasks with high response probability (A cues in AX70 and BX70) or high need for control (B cues in AX70); C) Histograms showing mean power (+/− standard error) in the beta range for the three periods analyzed (Sens: sensory; Eval: evaluation; Prep: preparatory), for the three task variants.

