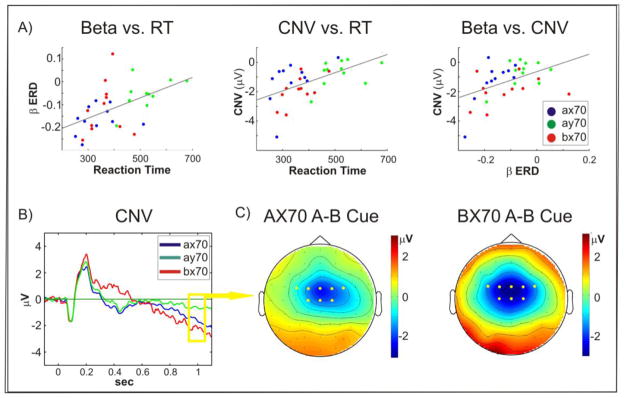
Figure 4. Correlations.
A) Beta ERD (left panel), as well as CNV amplitudes (middle panel), were significantly correlated with reaction time across all tasks. In addition, Beta ERD correlated with CNV amplitude (right panel); B) Grand average of evoked potentials recorded at FCZ to A cues in the three tasks. The CNV was more negative in AX70 and BX70 than in AY-70. C) Spatial distribution of the voltage difference between A and B cues for tasks AX70 and BX70.

