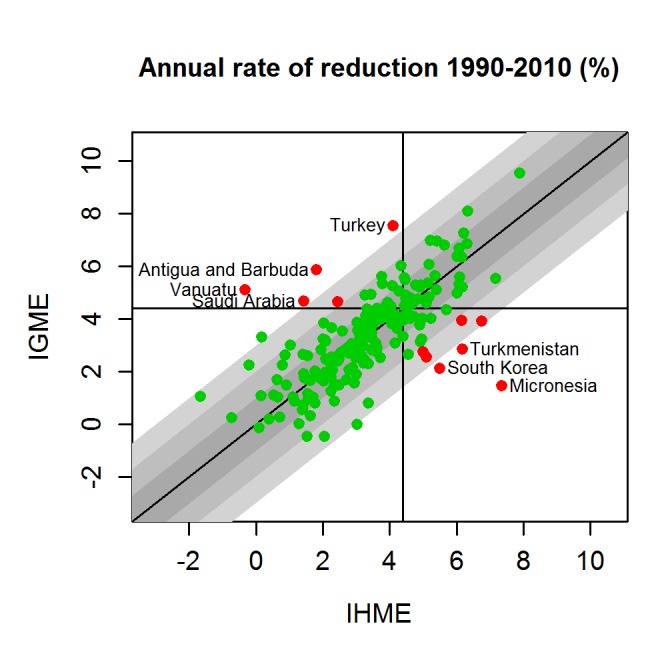
Figure 3. UN IGME and IHME estimates of the annual rate of reduction for 1990–2010.

UN IGME estimates are plotted against IHME estimates. Grey area illustrates absolute differences of up to 1%, 2%, and 3%, respectively (absolute difference). Red indicates that the difference is at least 2% and the conclusion as to whether the country is on track to meet MDG 4 (a 4.4% annual decline) differs between the IHME and the UN IGME.
