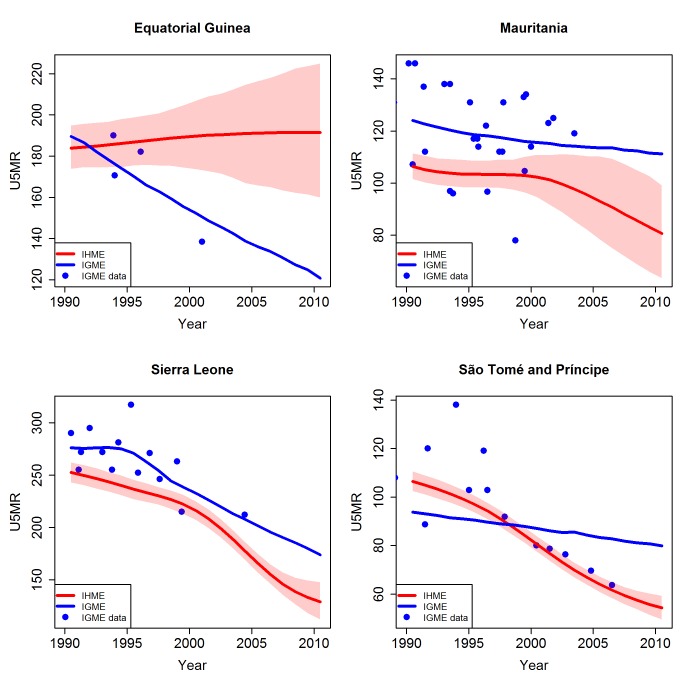
Figure 6. Comparison of U5MR estimates from 1990 to 2010 for examples of countries where different data series were included and excluded by the UN IGME and the IHME.
Estimates by the UN IGME (blue line) and the IHME (red line, with 95% confidence intervals represented by the shaded areas). Data from the UN IGME 2011 database (IGME data) are added as blue dots.

