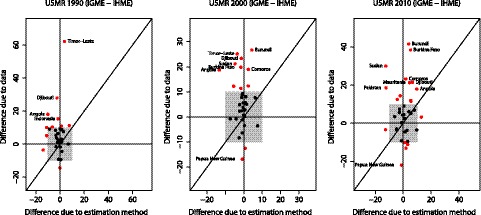
Figure 10. Decomposition of differences in U5MR for 1990, 2000, and 2010 into differences due to data and differences due to use of GPR.

The grey box represents differences up to ten deaths per 1,000 births. Countries for which the difference due to either factor is larger than ten deaths per 1,000 births are highlighted in red.
