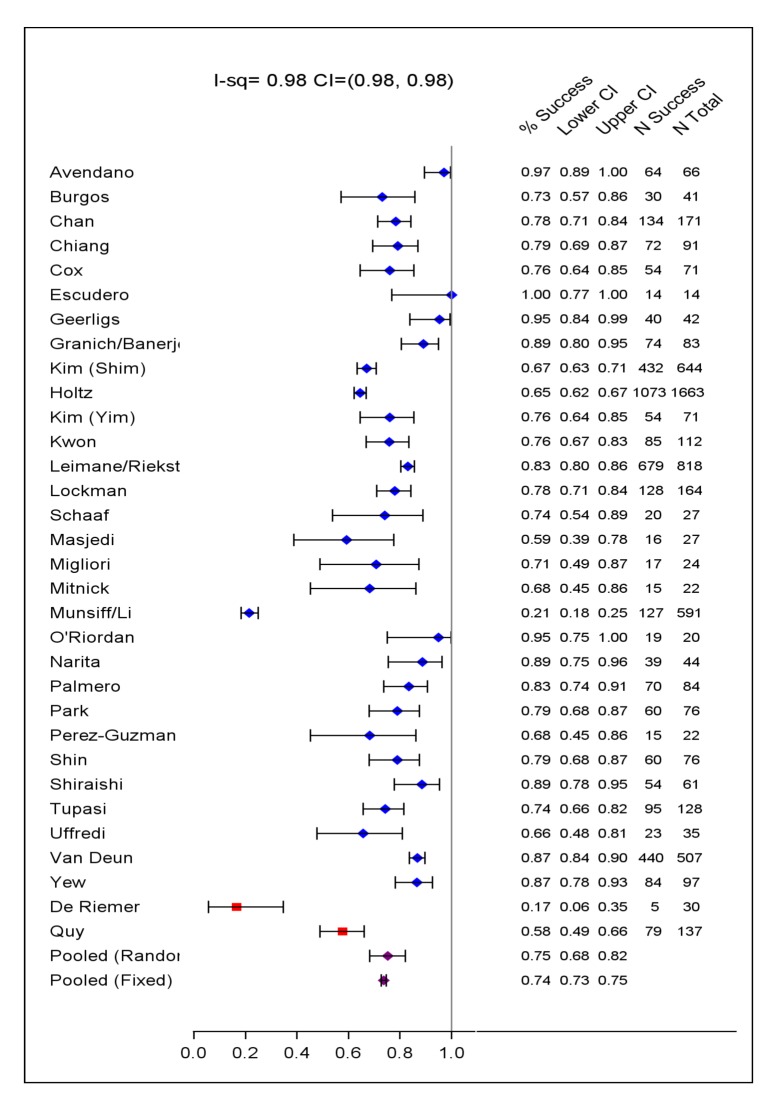
Figure 2. Treatment success versus failure and relapse and death.
Crude treatment success versus failure or relapse or death by study with exact 95% CI, as well as number of subjects with success and number of subjects treated. Fixed and der Simonian and Laird random effects pooled estimates are given (purple dots). Two studies that used only first-line TB drugs are indicated by a red square.

