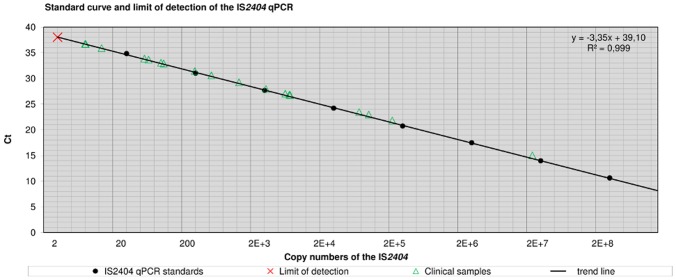
Figure 4. Standard curve and limit of detection of the IS2404 qPCR.
Figure 4 shows mean Ct-values of calibration standards and clinical samples plotted versus the quantified copy number of IS2404. Cloned IS2404 templates were used as standards (Table 5). Log 10 fold serial dilutions (n = 8) were prepared ranging from 2E+8 to 20 copies of the IS2404 (PCR template: 2 µl) and were subjected to the IS2404 qPCR in quadruplicate to generate a calibration curve. The regression line was y = −3.35x+39.10 with a coefficient of correlation >0.99 and the efficiency was E = 0.97. The analytical sensitivity was determined as limit of detection (LOD) by subjecting 10 aliquots of a dilution series containing 10, 5, 4, 3, 2, or 1 copy of the IS2404 to the assay. The LOD was 2 copies of the target sequence.

