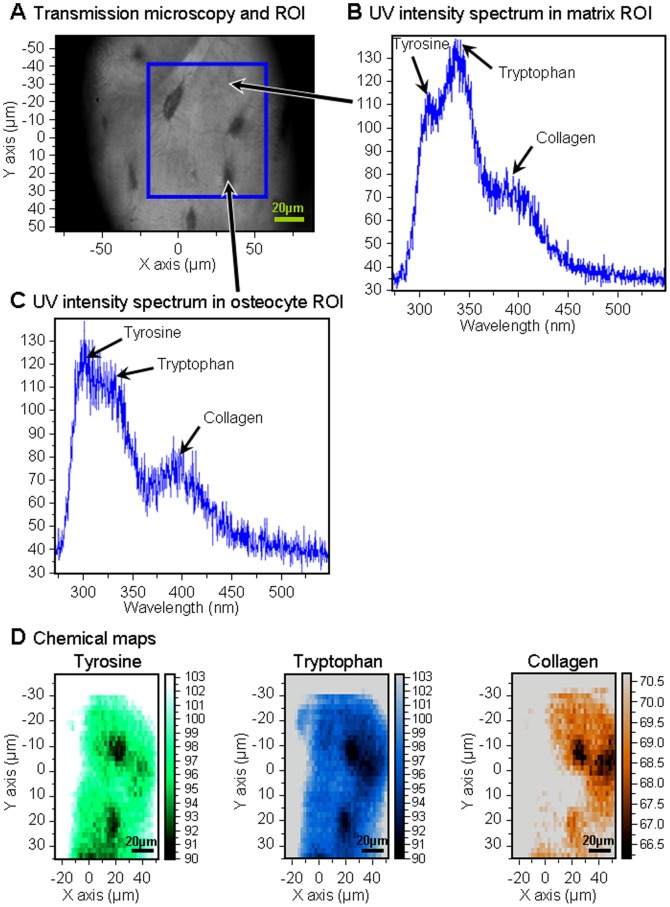
Figure 3. UV spectroscopy results from osteocyte and surrounding matrix ROI.
A: Transmission microscopy image showing ROIs. B: UV intensity spectrum originating from one matrix ROI pixel (indicated with an arrow). C: UV intensity spectrum originating from one osteocyte ROI pixel as shown. D: UV chemical maps of osteocytes and surrounding matrix showing the tyrosine (green), tryptophan (blue), collagen (orange) distribution within the blue square marked in (a).

