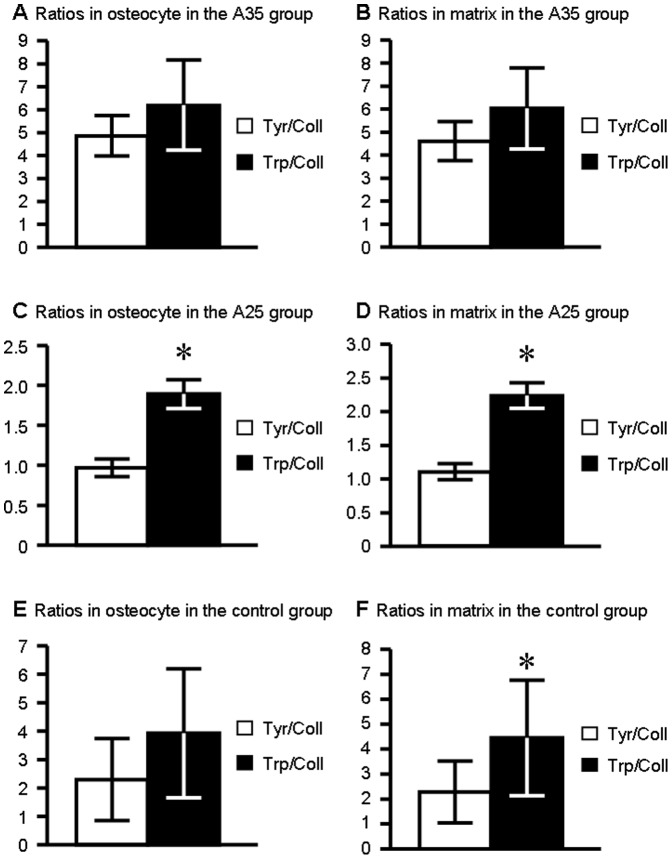
Figure 5. Tyrosine/Collagen and Tryptophan/Collagen ratios in osteocyte and surrounding matrix for the different groups.
A: Comparison between Tyrosine/Collagen and Tryptophan/Collagen ratios in osteocyte ROI in A35. B: Comparison between Tyrosine/Collagen and Tryptophan/Collagen ratios in matrix ROI in A35. C: Comparison between Tyrosine/Collagen and Tryptophan/Collagen ratios in osteocyte ROI in A25. D: Comparison between Tyrosine/Collagen and Tryptophan/Collagen ratios in matrix ROI in A25. E: Comparison between Tyrosine/Collagen and Tryptophan/Collagen ratios on osteocyte ROI for controls. F: Comparison between Tyrosine/Collagen and Tryptophan/Collagen ratios on matrix ROI for controls. shows a significant difference between the ratios (p<0.05). Ratios are expressed as mean ± standard deviation (sd).

