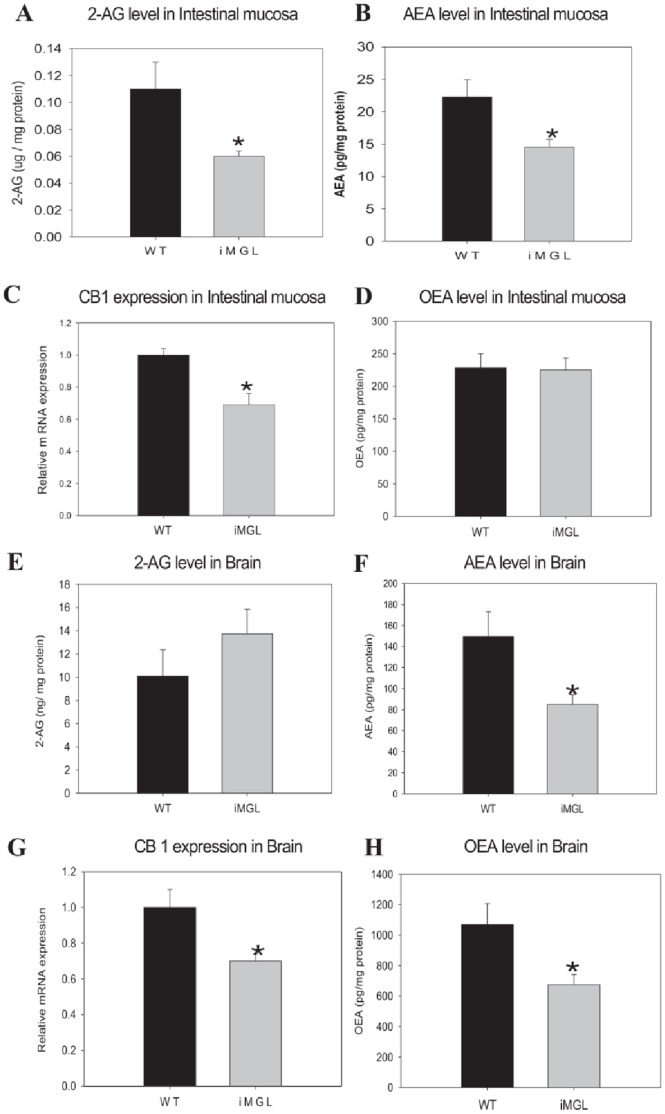
Figure 7. Endocannabinoid (EC) levels and CB1 expression in iMGL mice small intestine and brain.
(A) 2-AG level in iMGL mice small intestine (n = 6 per group). (B) AEA level in iMGL mice small intestine (n = 6 per group). (C) CB1 mRNA expression in iMGL mice small intestine by QPCR analysis (n = 6 per group). Values are presented relative to the expression of the wild type littermates set to 1. (D) OEA levels in small intestinal mucosa (n = 8per group). (E) 2-AG level in iMGL mice brain (WT; n = 5, iMGL; n = 9). (F) AEA level in iMGL mice brain (WT; n = 5, iMGL; n = 9). (G) CB1 mRNA expression in iMGL mice brain by QPCR analysis (n = 6 per group). Values are presented relative to the expression of the wild type littermates set to 1. (H) OEA levels in brain (WT; n = 5, iMGL; n = 9). Data represent mean ± S.E. * p<0.05 versus wild type littermates.

