
Figure 2. HCV infection affects intracellular localization, expression levels, and activities of focal adhesion molecules.
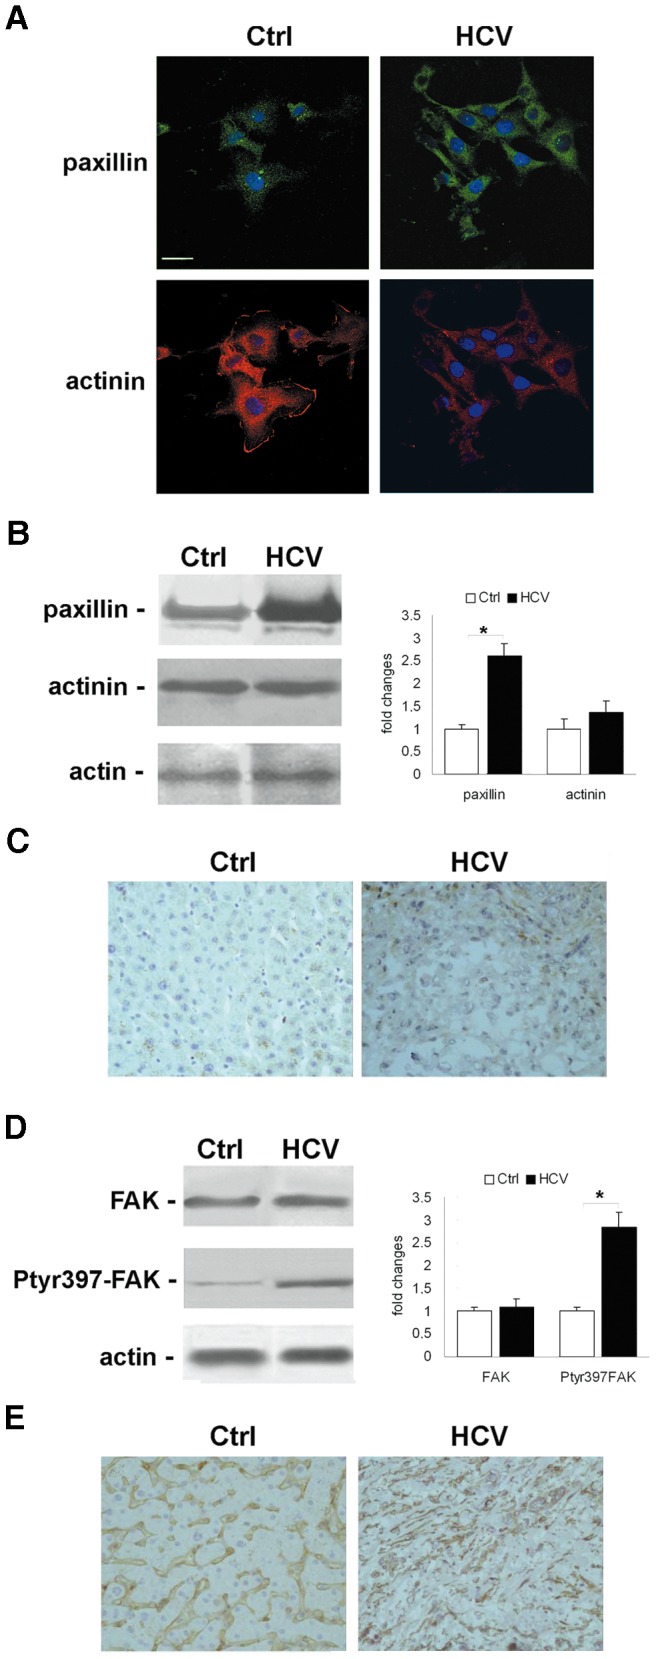
(A) Immunofluorescence of paxillin (green), and alpha-actinin (red) by confocal microscopy in Ctrl and HCV Huh7.5.1 cells after 24 hrs from plating. DAPI (blue) was included to stain the nuclei. Magnification bar: 30 µ. (B) Paxillin and alpha-actinin protein expression levels observed 24 hrs after plating. (C) Immunohistochemical analysis of paxillin expression in HCCs and control livers (×200 magnification). (D) Total FAK and tyrosine 397 phosphorylated FAK were observed 24 hrs after plating. Immunoblots are representative of at least four independent experiments. (E) Immunohistochemical analysis of tyrosine 397 phosphorylated FAK expression in HCCs and control livers (×200 magnification). In left histograms densitometric analysis is reported as fold changes in protein levels respect to the control cells considered as 1 after normalization against beta-actin (as loading control). *P<0.001 versus Ctrl.