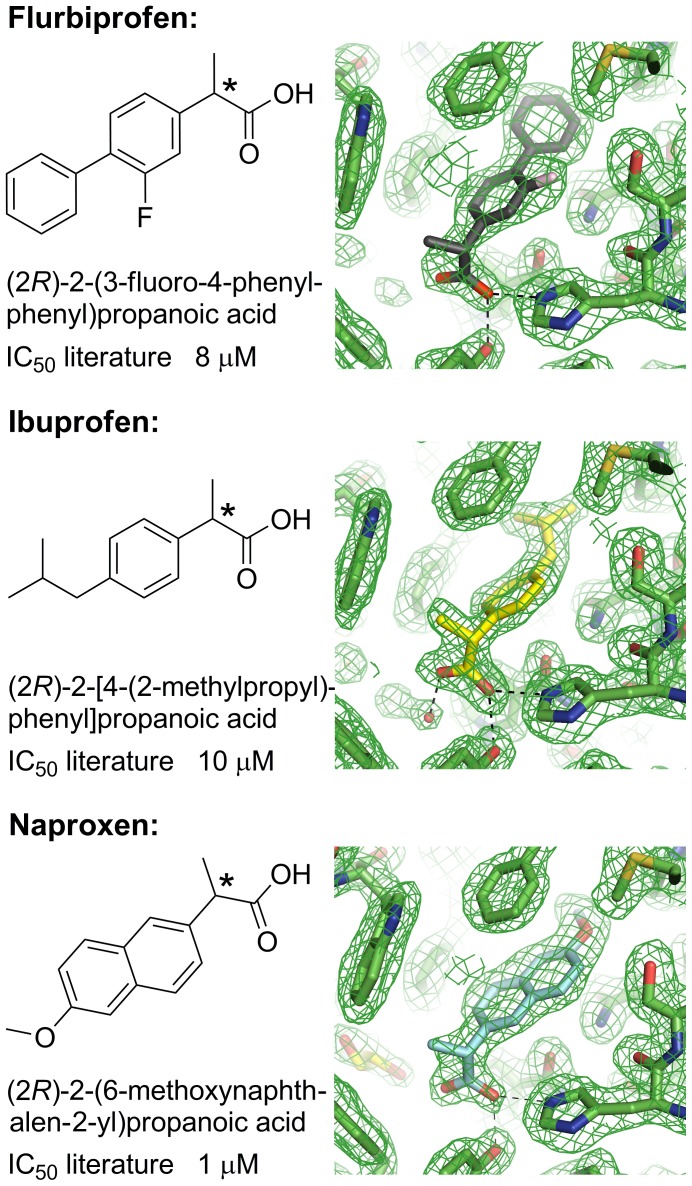
Figure 5. Molecular structures, systematic names, and IC50 values against AKR1C3 for the arylpropionic acids (flurbiprofen, ibuprofen, naproxen).
The chiral centre of each molecule is labelled with an asterisk. Electron density maps (2Fo-Fc omit maps drawn at the 1σ level) are shown for each active site (see Figures S2C, S2D and S2E for larger versions of the maps). The ligands are modelled at full occupancy. Figures drawn using ChemBioDraw Ultra 12.0 (CambridgeSoft) and Pymol v1.3 incentive (Schrödinger, LLC). IC50 values taken from Byrnes and Penning, 2009 [32].

