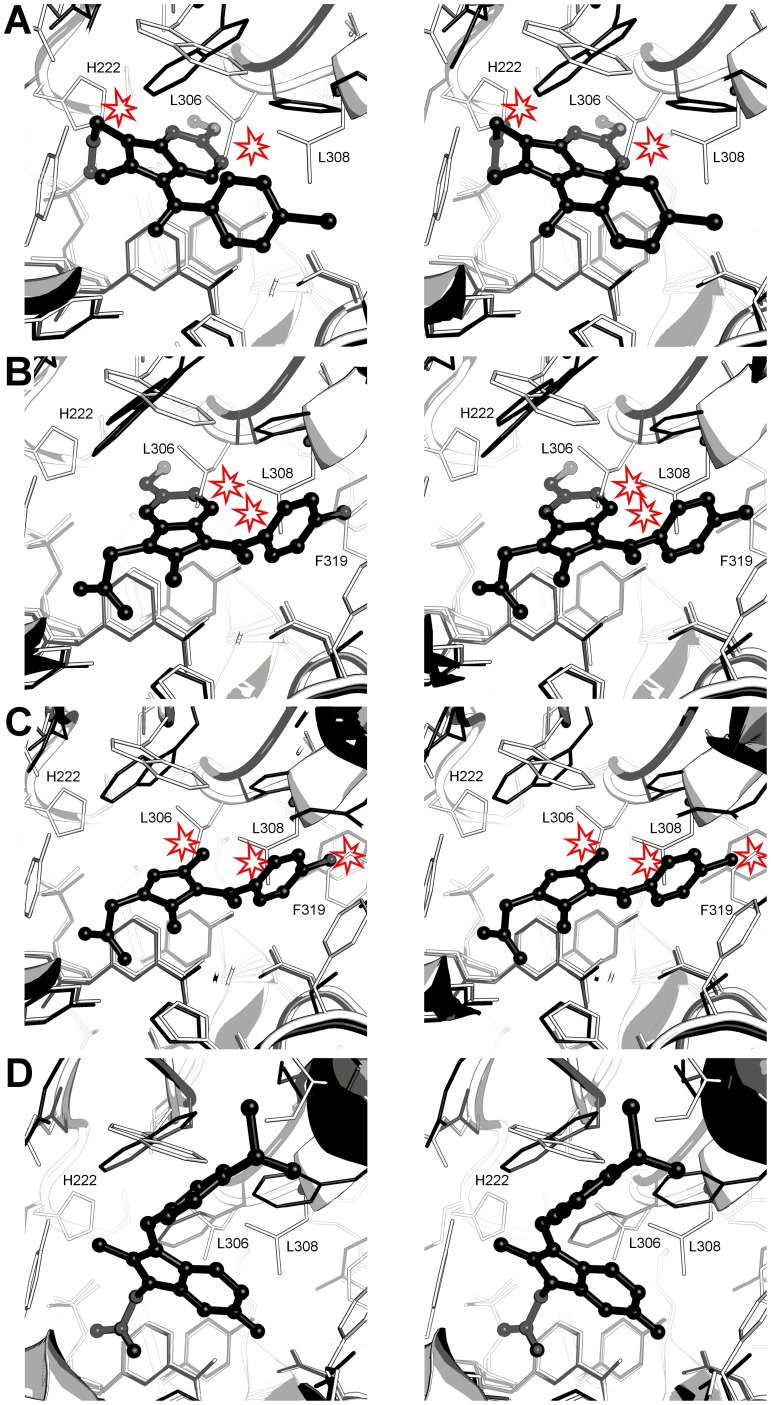
Figure 11. Comparison of AKR1C1, 1C2, and 1C3 active sites and indomethacin or sulindac binding modes.
A. The indomethancin, pH 6.0 binding mode in AKR1C3 (black) and AKR1C1/2 (white) active sites. Clashes between the inhibitor and AKR1C1/2 are indicated. B. The indomethancin, pH 7.5 binding mode in AKR1C3 (black) and AKR1C1/2 (white) active sites. Clashes between the inhibitor and AKR1C1/2 are indicated. C. The zomepirac binding mode in AKR1C3 (black) and AKR1C1/2 (white) active sites. Clashes between the inhibitor and AKR1C1/2 are indicated. D. Sulindac binding in AKR1C3 (black) and AKR1C1/2 (white) active sites. In each figure the numbering corresponds to the AKR1C2 amino acid sequence.

